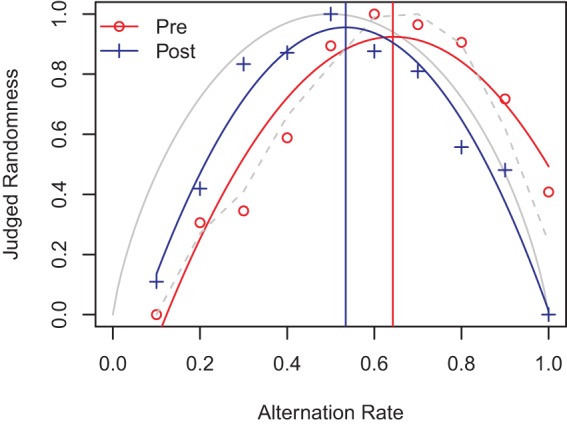
Figure 9.

A quadratic function fitted to pre and post judgments at the group level. The peak of the postexposure judgments has shifted toward the theoretical value of 0.5. The vertical lines show the peak of the fit. The gray dashed line shows the original data collected by Falk and Konold (1997) p. 314, a close match to our pre-exposure data. Solid gray line shows second-order approximate entropy (Beltrami, 1999) of the alternation rate. See the online article for the color version of this figure.
