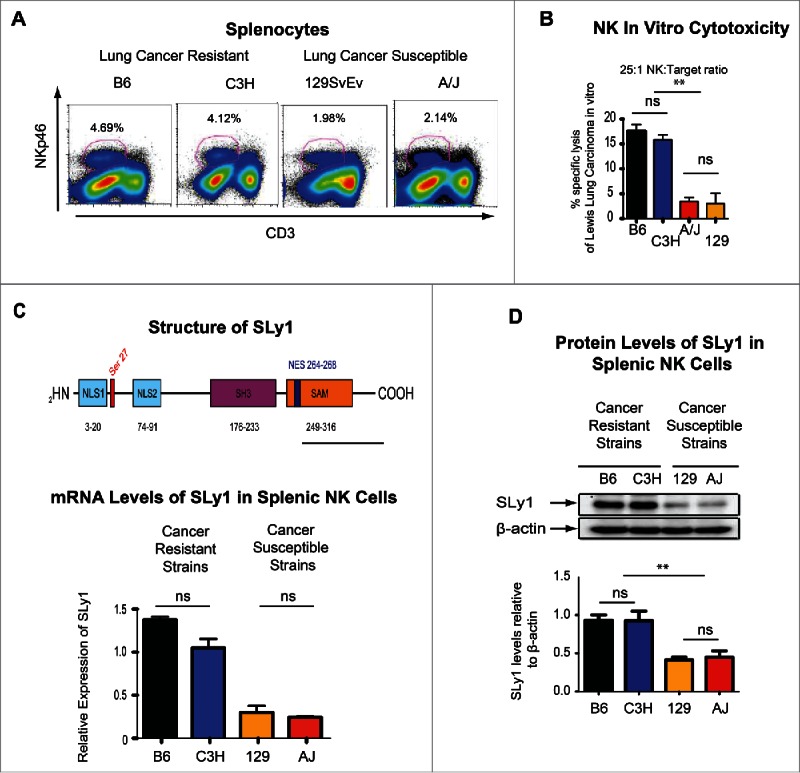
Figure 1.

Strain-specific differences in cancer susceptibility and SLy1 levels. (A) Strain-specific differences in the number of splenic NK cells (defined as NKp46+CD3−). Graphic data showing one representative FACS plot from three to six animals. (B) Strain-specific differences in in vitro specific lysis of Lewis Lung Carcinoma (LLC) by splenic NK cells at a 25:1 effector:target ratio by 51Cr-release assay (representative of four separate experiments with comparison performed by unpaired t-test). (C) Structure of SLy1 (top) and relative levels of SLy1 in splenic NK cells of various strains of mice as measured by mRNA gene expression array (bottom). (D) SLy1 levels in freshly isolated splenic NK cells as measured by Western blot analysis (four animals per group). Comparison performed by unpaired t-test. *p < 0.05, **p < 0.01, ns = p > 0.05.
