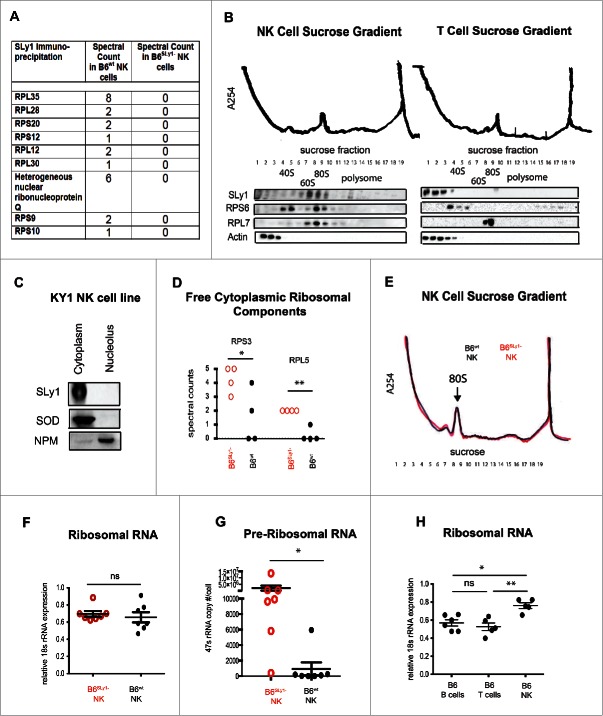
Figure 5.
SLy1 contributes to ribosome stability in NK cells. (A) Mass spectroscopy of anti-SLy1 co-immunoprecipitation of B6wt and B6SLy1−NK cells. Proteins quantitated by spectral counts of peptides. Ribosomal proteins associated with the small 40S subunit are defined as RPS (ribosomal protein small), with the appropriate protein number after the RPS designation. Ribosomal proteins associated with the large 60S subunit are defined as RPL (ribosomal protein large), with the appropriate protein number after the RPL designation. (B) Sucrose density gradient fractionation and Western blot analysis of SLy1 localization of freshly isolated NK cells (left panel) and T lymphocytes (right panel). Representative of four separate experiments. (C) Western blot analysis of cytoplasm and nucleolar SLy1 in the KY1.1 NK cell line utilizing nucleophosmin (NPM) and superoxide dismutase (SOD) for nucleolar and cytoplasmic localization, respectively. (D) Spectral counts of free ribosomal components, not associated with the ribosome, in B6SLy1− in B6wt NK cells by mass spectroscopy. Comparison performed by t-test. (E) Sucrose density gradient fractionation with A254 absorbance evaluation of ribosome formation in freshly-isolated B6wt (black) and B6SLy1−(red) NK cells. Representative of three separate experiments. (F) RT-PCR of 18S rRNA expression in freshly isolated NK cells from B6wt (black) and B6SLy1−(red) mice. (G) RT-PCR analysis of 47S rRNA copy number in freshly isolated NK cells from B6wt (black) and B6SLy1−(red) mice. Comparison performed by unpaired t-test. (H) RT-PCR of 18S rRNA levels in freshly isolated T cells, B cells and NK cells from B6 mice. Expression normalized to β-actin. Comparison performed by One-way ANOVA followed by Bonferroni post-test. *p < 0.05, **p < 0.01, ns = p > 0.05.

