Figure 7.

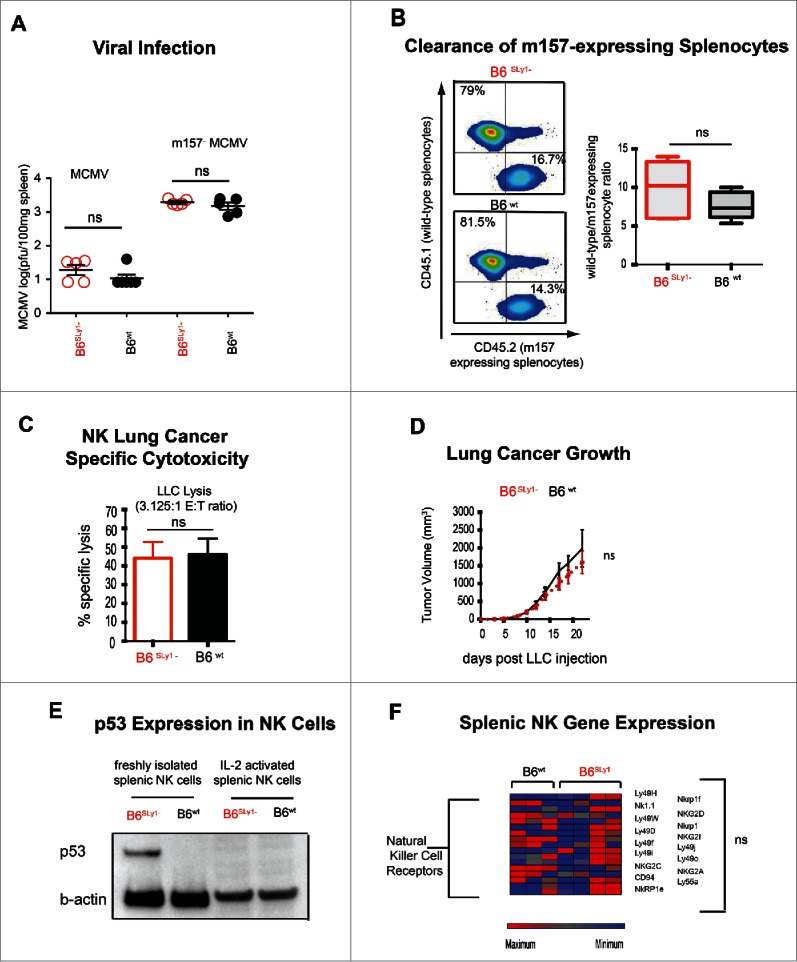
Phenotype of activated B6SLy1−and B6wt NK cells. (A) MCMV and m157−MCMV viral titers in the spleens of B6SLy1− (red) and B6wt (black) mice seventy-two hours after infection. (B) In vivo clearance of B6CD45.1+wild-type or B6CD45.2+m157-expressing splenocytes injected into IL-2 treated B6SLy1− (top) and B6wt mice (bottom) recipient mice. Data derived from flow cytometric analysis of the spleen, demonstrating one representative experiment on the left and summary of five animals on the right. Comparison performed by unpaired t-test between ratios. (C) In vitro lysis of LLC at a 3.125:1 effector:target ratio with NK cells isolated from the spleens of B6SLy1−(red) or B6wt (black) mice and expanded in high dose IL-2 for one week in vitro. (D) Growth of LLC injected into the flank of B6SLy1− (red line) and B6wt mice (black line) treated with 10 doses of 75,000 IU of wild-type IL-2. Representative of two separate experiments with four mice per group per experiment. (E) Comparison of p53 levels in resting and IL-2 activated B6SLy1−and B6wt NK cells (representative of two separate experiments). (F) Relative mRNA expression of various activating receptors, adhesion molecules and signaling intermediates in IL-2 activated NK cells from B6SLy1− and B6wt mice.
