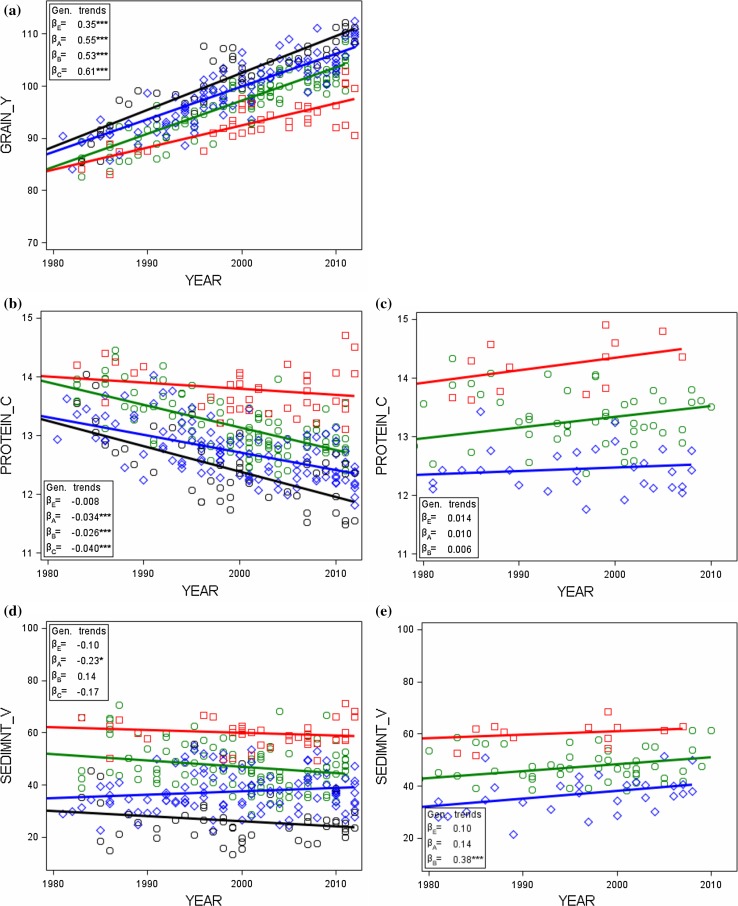
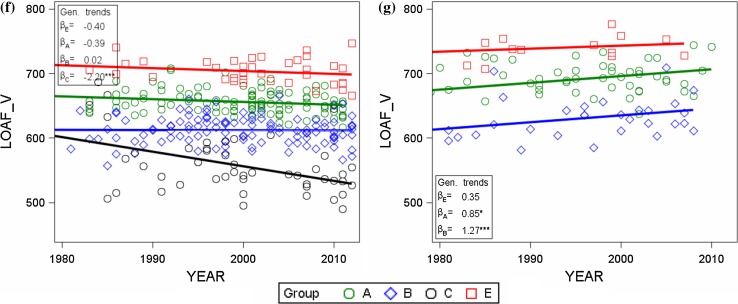
Fig. 4.
VCU trial (left column) and on-farm (right column) adjusted means [G i in Eq. (1)] by quality groups (grades in descending order are E elite wheat, A quality wheat, B bread wheat, C others) plotted against first year in trial with group regression lines for(a) grain yield, (b) and (c) crude protein concentration, (d) and (e) sedimentation value, and (e) and (f) loaf volume. Regression lines for quality groups are plotted to display genetic trends as indicated in inset boxes (Table 4). β E, β A, β B, β C genetic trends for quality groups [Eq. (1) using Eq. (6)]. GRAIN_Y grain yield, PROTEIN_C crude protein concentration, SEDIMNT_V sedimentation value, LOAF_V loaf volume, on-farm loaf volume (calculated)


