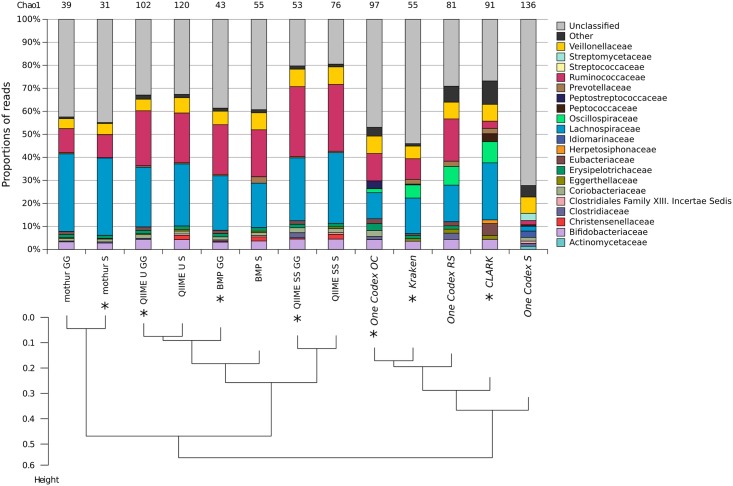
Fig 8. Proportions of the top 10 families per pipeline on a real dataset, and their matching Chao1 diversity indexes (computed after taxonomic merging) at the family level.
Below, average linkage hierarchical clustering of all pipelines based on a Euclidean distance calculation on the amount on all reads per family per pipeline (excluding unclassified reads). Pipelines are marked with a * when executed with their default database.

