
Figure 1.
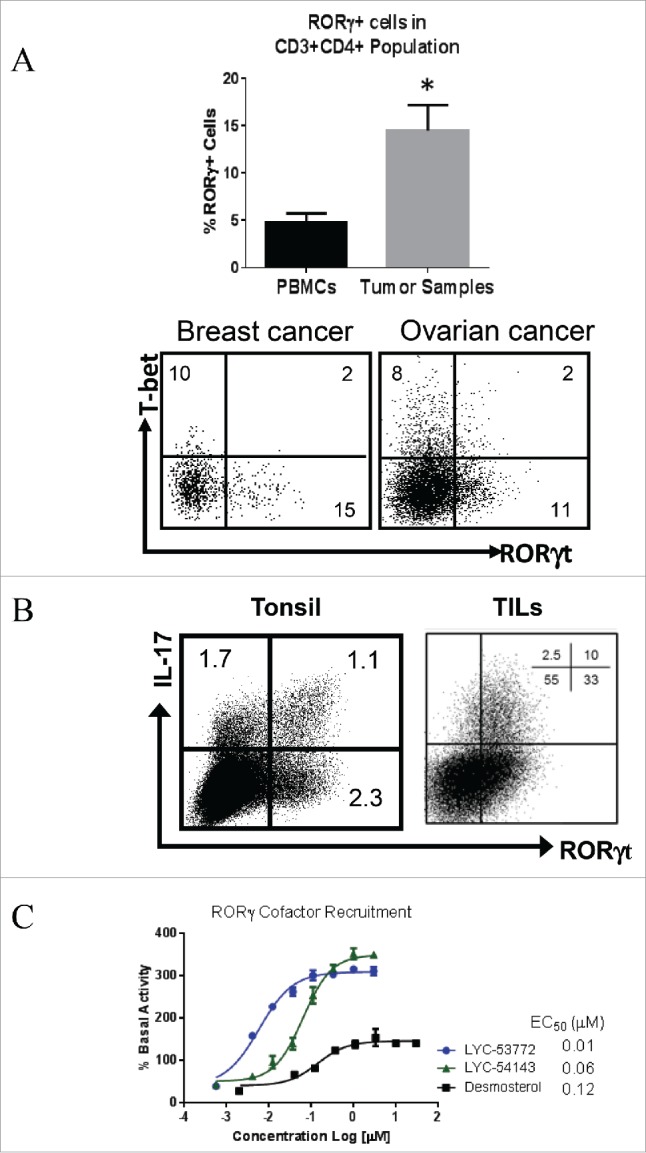
Expression of RORγ in human tumors and identification of RORγ agonists. (A) RORγ+ T cells are present in significant fractions in TILs from various tumor types. Total of 14 tumor samples from colon, ovarian, lung, breast and head and neck cancers. Cells were gated on CD45+CD3+CD4+. *p = 0.03 tumor vs. PBMCs. Unpaired, two-tailed t-test. Bottom. Flow graph shows an example of staining. (B) Co-staining of IL-17A and RORγt shows partial overlap of RORγ and IL-17A expressing cells. (C) A TR-FRET-based assay was used to show that RORγ agonists increase co-activator recruitment. Each data point represents mean ± standard deviation (SD) of biological triplicates.