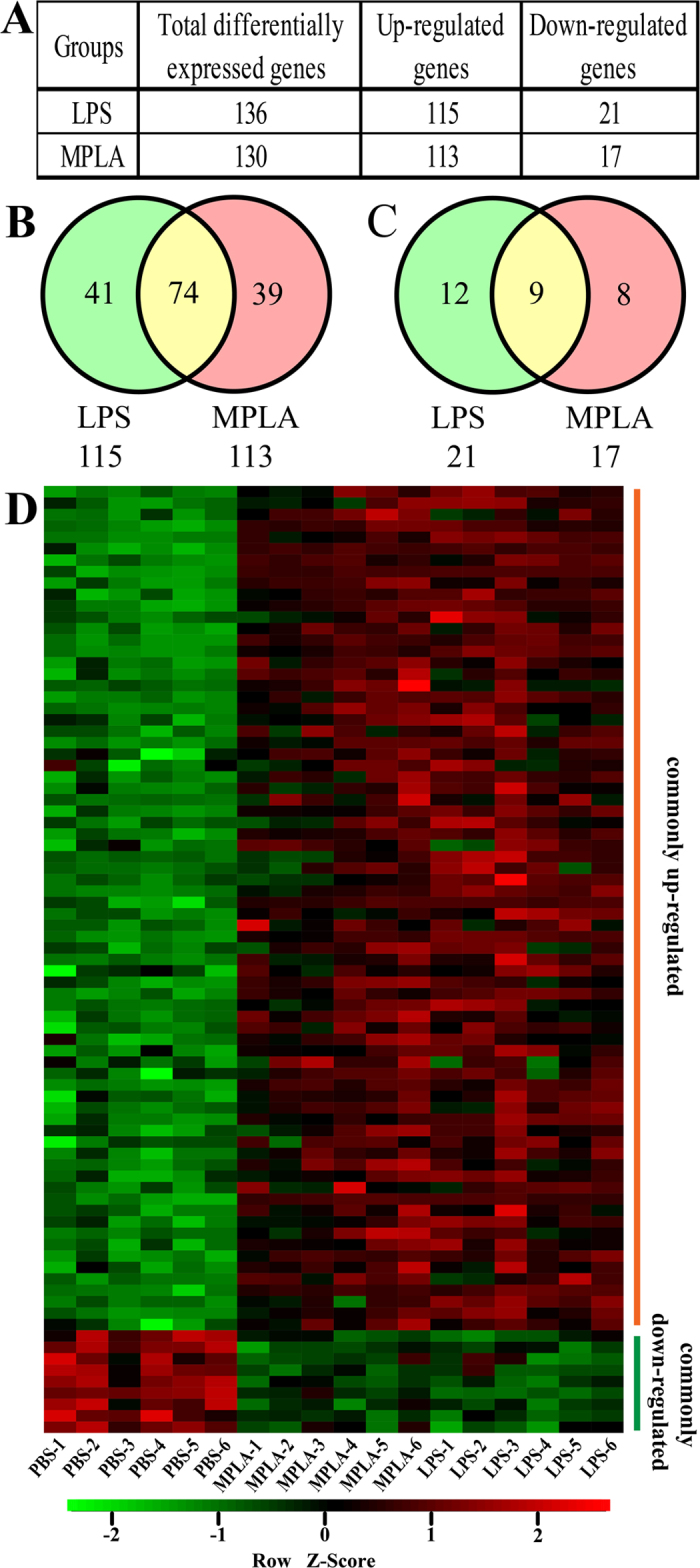
Figure 1. Lipopolysaccharide and Monophosphoryl Lipid A Induce Similar Transcriptome Profiles in Human Blood.

(A) Numbers of differentially expressed genes after LPS or MPLA treatment. (B) Venn diagram indicating the overlap of genes that were significantly upregulated after LPS and MPLA treatment. (C) Venn diagram indicating the overlap of genes that were significantly downregulated after LPS and MPLA treatment. (D) Heat map of the hierarchical clustering of commonly regulated genes depicting their expression patterns and variation in human blood samples treated with LPS, MPLA, or vehicle control (PBS). The color key indicates the direction of changes, with red depicting genes significantly up-regulated and green showing genes significantly down-regulated. Genes were clustered based on their expression values across samples using Pearson correlation and complete linkage function.
