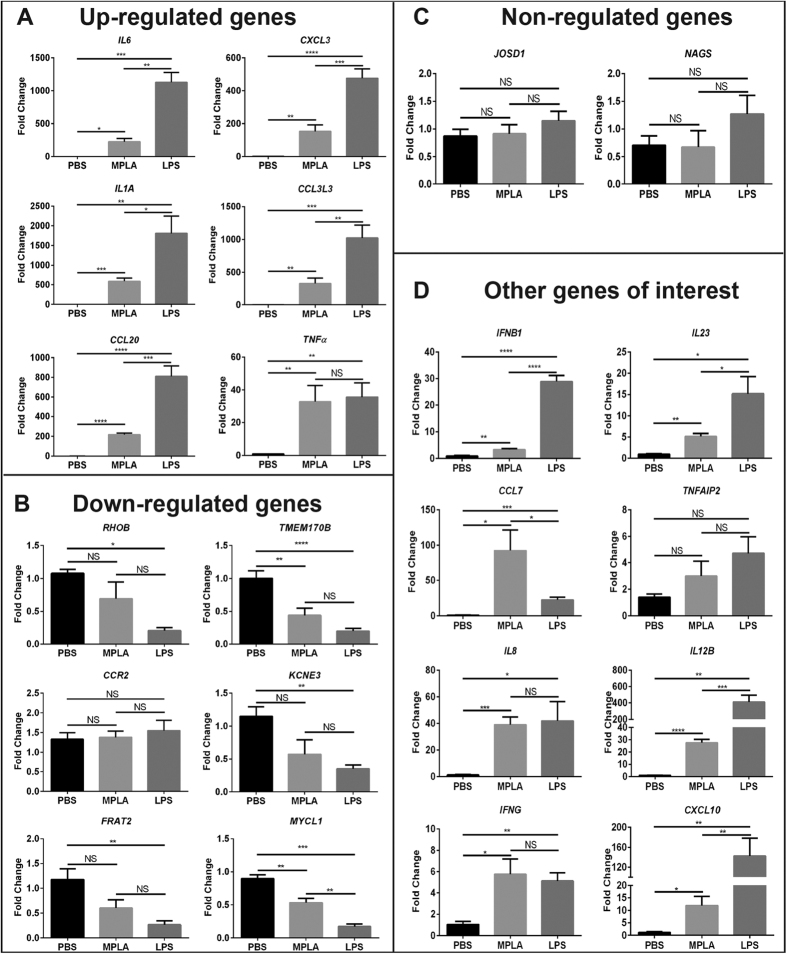
Figure 2. Validation of Microarray Data by Quantitative Real-Time PCR.
(A) qPCR validation of six genes randomly chosen from top up-regulated genes in our genomic analysis. (B) qPCR validation of six genes randomly chosen from most down-regulated genes in our genomic analysis. (C) qPCR validation of two random non-regulated genes. (D) qPCR validation of eight genes of interest chosen based on their expression patterns. ΔΔCt values graphed are relative to the endogenous controls HPRT1 with SEM. *p < 0.05, **p < 0.01, ***p < 0.001, ****p < 0.0001, NS = not significant; n = 4 in each group, and qPCR was performed in triplicate.

