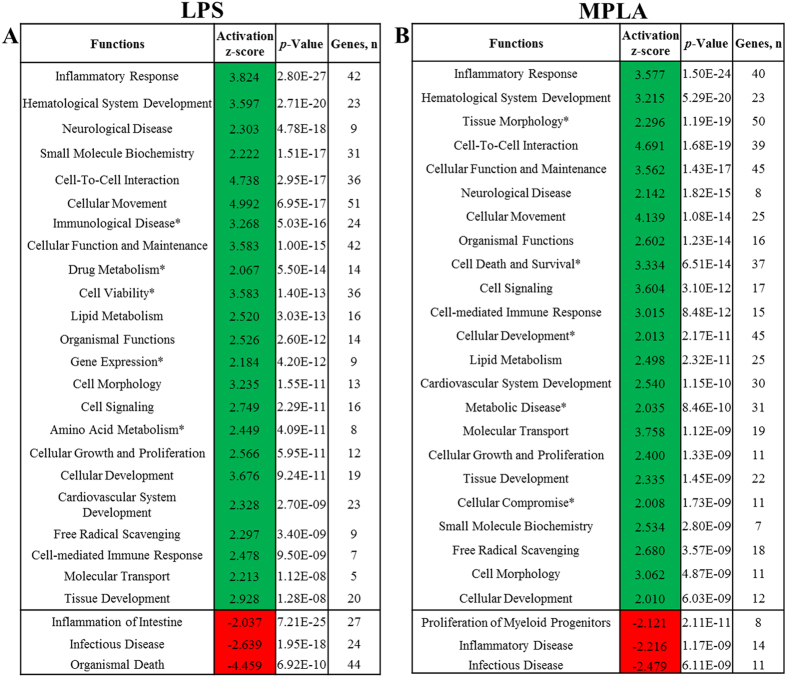
Figure 5. Functional Analysis.
Differentially expressed genes in LPS (A) and MPLA (B) treated human blood were used for Functional analysis in IPA software. Only functional annotations that obtained a Regulation z-score value higher than the absolute value of 2, which is considered significant and therefore for which IPA could predict the Activation State, are presented. Green indicates functions that were up-regulated and red indicates functions that were down-regulated. Asterisks, the functions that are activated by LPS or MPLA only. P-value < 0.05 calculated by Fisher’s Exact test; “Genes, n” = number of genes associated to annotation in our datasets.

