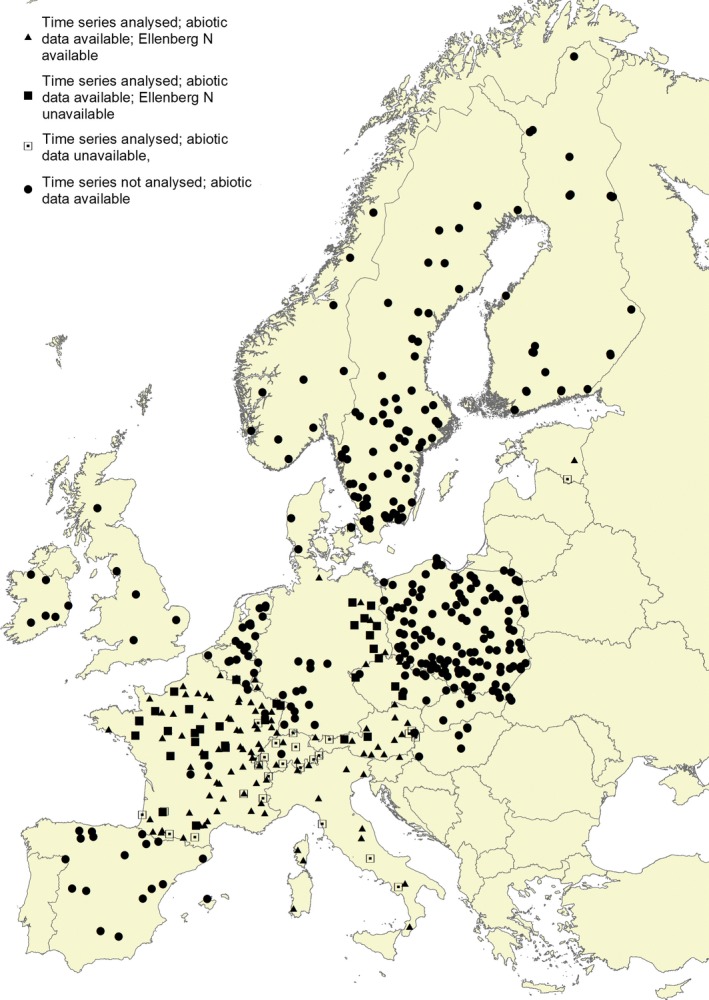
Figure 1.

Location of the plots. Explanation of symbols: closed = sufficient abiotic data available, open = insufficient abiotic data; circle = time interval between first and last relevé <7 years, square = time interval >6 years but insufficient species to compute Ellenberg N in both years, triangle = time interval >6 years and sufficient species to compute Ellenberg N
