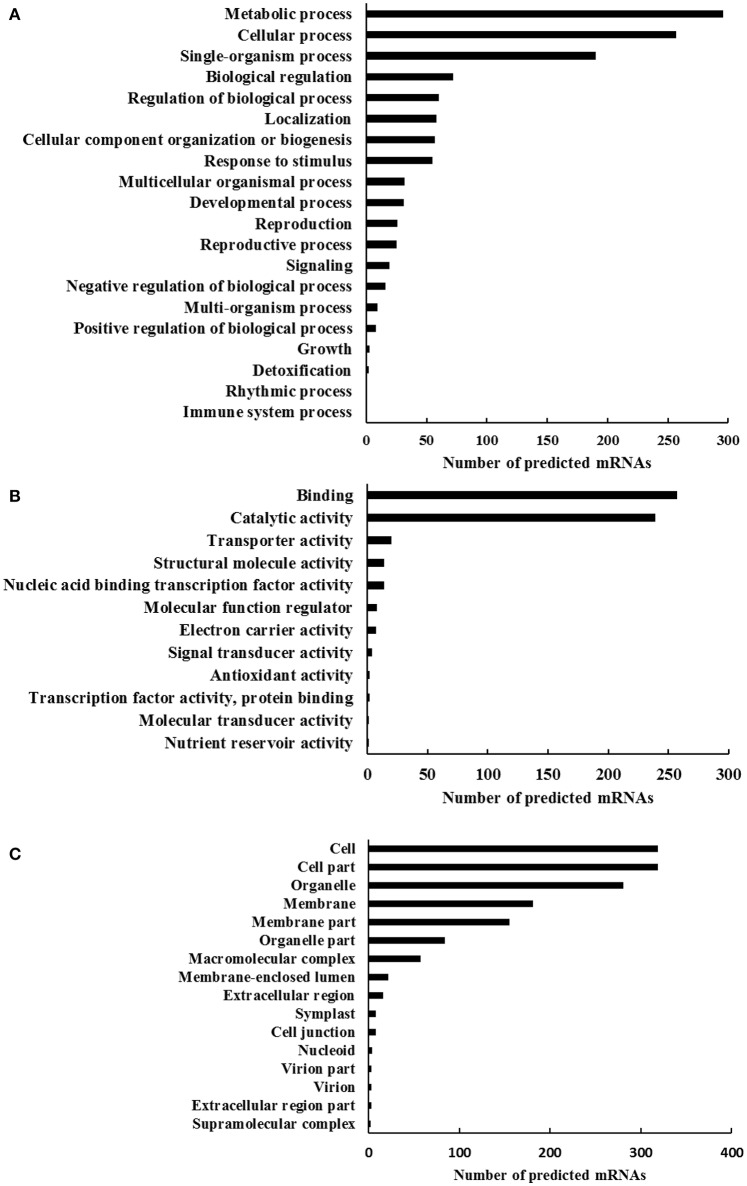
Figure 3.
The gene ontology profile of the mimic mRNA targets of the differentially expressed circRNAs in wheat seedlings leaves. The bar charts represent the functional annotations of most relevant (A) biological processes, (B) molecular functions, and (C) cellular components until the second level of complexity.

