
Figure 1. Diffusivity as a function of pressure for different temperatures from 1032 to 1800 K obtained from ab initio molecular dynamics simulations of liquid Si.
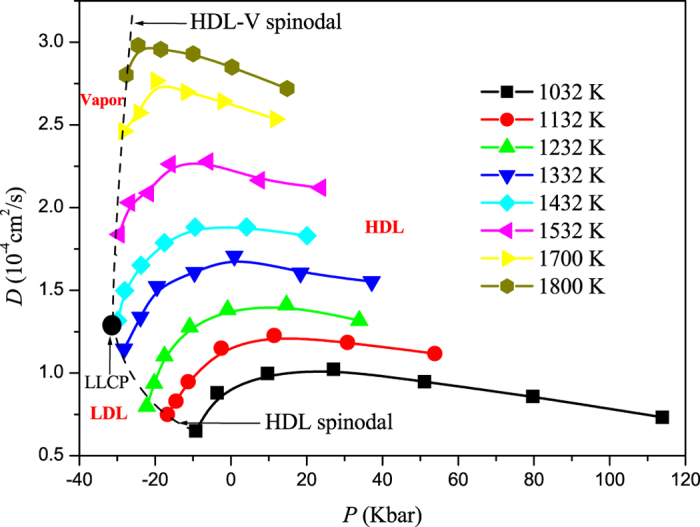
The maximum in diffusivity demarcates the regions of normal and anomalous behaviour in T-P phase diagram.