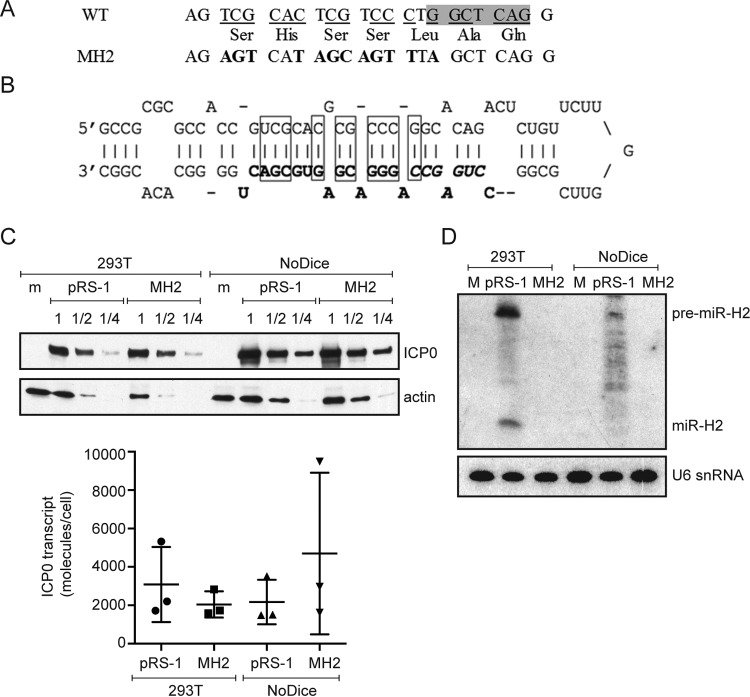
FIG 2.
miR-H2 mutations that do not affect ICP0 expression. (A) Mutations introduced into miR-H2. The top row shows the WT ICP0 gene sequence antisense to miR-H2, with the shaded area representing the sequence complementary to the seed region. The bottom row gives the corresponding mutant sequence with the altered nucleotides in bold letters. The middle row shows the predicted amino acid sequence encoded by both DNA sequences. (B) Sequence and hairpin structure of pre-miR-H2 showing mature miR-H2 in boldface, its seed region in boldface italics, and the base pairs that would be disrupted by the MH2 mutations in rectangles. (C) (Top) HEK293T wild-type and NoDice cells were either mock transfected (m) or transfected with the ICP0-expressing plasmid pRS-1 or the corresponding plasmid containing the miR-H2 mutations, pRS-1MH2. Protein samples were harvested at 24 hpt and serially diluted in twofold steps. Western blot analysis was conducted to compare the ICP0 protein levels in the different samples with the level of actin as an internal control. (Bottom) Total RNA samples were prepared at 24 hpt and analyzed for ICP0 mRNA levels by qRT-PCR. Horizontal bars and error bars represent mean values and standard deviations of the means, respectively, for three independent experiments. Differences were not statistically significant in either cell type (paired Student's t test). (D) 293T or NoDice cells were either mock transfected (M), or transfected with pRS-1 or pRS-1MH2 as indicated. At 24 hpt, <200-nucleotide RNA was isolated from transfected cells and analyzed by Northern blot hybridization, first being probed for miR-H2 and then stripped and probed with the U6 snRNA probe as an internal loading control.

