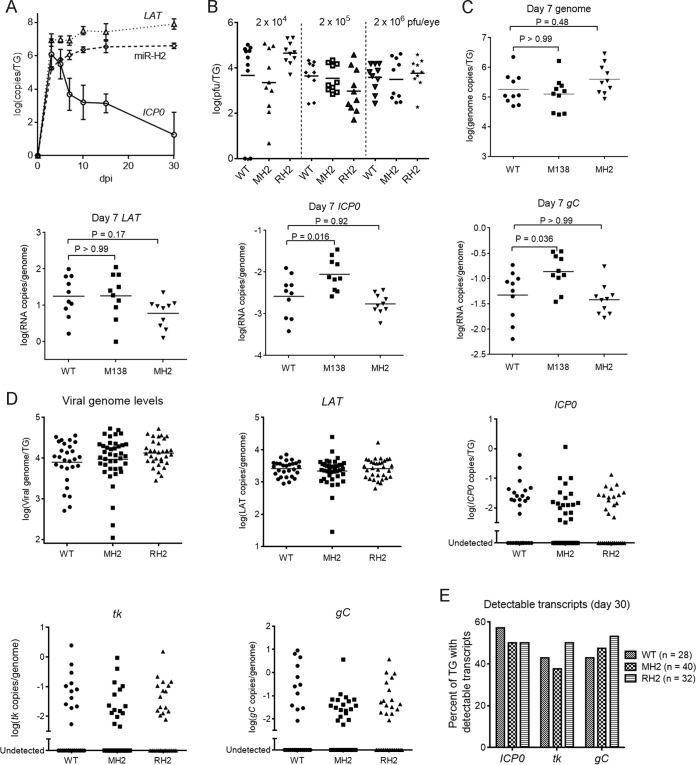
FIG 5.
The MH2 mutations have little effect on viral replication and transcript levels in murine TGs. (A) Time course of miR-H2, LAT, and ICP0 mRNA expression in murine TGs. Mice were inoculated on the cornea with 2 × 10⁵ PFU of KOS per eye. At different dpi, 3 or 4 mice were euthanized and TGs were harvested and analyzed for ICP0 transcripts, stable LAT, and miR-H2 by qRT-PCR. RNA copy numbers were obtained by comparing the signals with standard curves generated using in vitro-transcribed ICP0 mRNA, LAT, or synthetic miR-H2. (B) Viral titers in TGs at 5 dpi following inoculation, with doses indicated at the top and virus names at the bottom. Data for different doses are separated by vertical dashed lines. Each point represents a value from one TG. The horizontal lines represent the geometric mean values (undetectable values were included in the calculations as 0). One-way ANOVA tests did not detect any significant differences between titers of viruses at each dose (P ≥ 0.16). (C to E) Mice were inoculated on the cornea with 2 × 10⁵ PFU/eye of the indicated virus. (C) Viral genome and transcript levels in TGs at 7 dpi. Each point represents a value from one TG. The names of the transcripts assayed are indicated at the top of each graph. Vertical axes show logarithmic values, and RNA levels were normalized to viral genome levels. The horizontal lines represent the geometric mean values. P values shown above the brackets were obtained by one-way ANOVA tests with Bonferroni's multiple comparison test. (D) Viral genome and transcript levels at 30 dpi as described in the legend to panel C, except that mean values are not indicated in the plots for viral lytic transcripts due to the large numbers of undetectable values. One-way ANOVA (for viral genome and LAT) and Kruskal-Wallis tests (for ICP0, tk, and gC transcripts) did not detect any significant differences (P ≥ 0.48). (E) Percentages of TGs exhibiting detectable lytic transcripts. Each vertical bar represents the value for each virus (indicated in the key) and each RNA (below the graph). Fisher's exact tests did not detect any significant differences for each transcript (P ≥ 0.34).

