FIG 3.
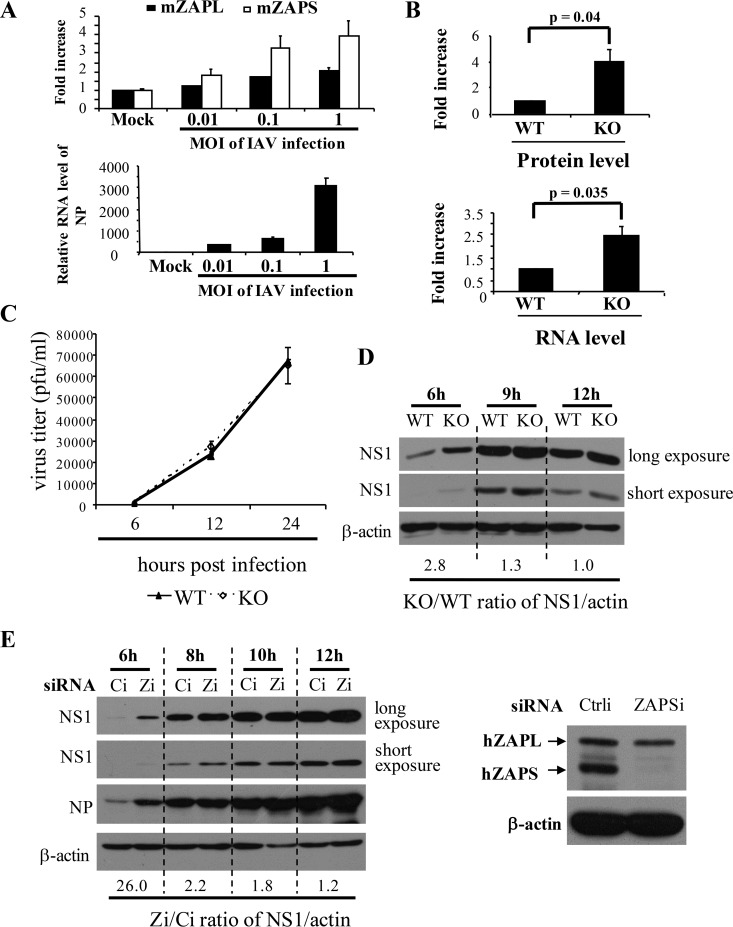
ZAPS inhibits IAV replication only at an early stage. (A) (Top) Wild-type MEFs were infected with IAV at the MOIs indicated for 1 h. At 12 h postinfection, total RNA was isolated. The mRNA levels of ZAPL, ZAPS, and IAV NP were determined by real-time PCR using GAPDH mRNA as an internal control. The fold increase in ZAPS and ZAPL mRNA levels was calculated as the relative RNA level in the cells infected with IAV divided by that in mock-treated cells. (Bottom) The NP mRNA levels confirmed that the cells were infected with increasing amounts of IAV. The data presented are means and SD of the results of two independent experiments. mZAPL and mZAPS, murine ZAPL and ZAPS, respectively. (B) (Top) Wild-type (WT) and ZAP knockout (KO) MEFs were transfected with a plasmid expressing PB2-luc, together with a control Renilla luciferase reporter. At 36 h posttransfection, the cells were lysed and luciferase activities were measured. Firefly luciferase activity was normalized to Renilla luciferase activity. The fold increase in protein levels was calculated as normalized luciferase activity in KO cells divided by that in WT cells. (Bottom) The cytoplasmic RNA was isolated, and reporter RNA levels were determined by real-time PCR. The firefly reporter RNA level was normalized to the Renilla mRNA level. The fold increase in the RNA levels was calculated as the normalized mRNA level in KO cells divided by that in WT cells. The data presented are the means and SD of the results of three independent experiments. (C) MEFs were infected with IAV at an MOI of 0.1 for 2 h. At the time points indicated, virus titers were determined. The data presented are the means ± SD of two independent measurements, representative of the results of three independent experiments. (D) MEFs were infected with IAV at an MOI of 1 for 1 h. At the time points indicated, NS1 expression levels were analyzed by Western blotting. The relative band intensities of NS1 were quantified with Image J software and normalized to the band intensities of β-actin. The ratio of the NS1 expression level in KO cells to that in WT cells was calculated. (E) (Left) HeLa cells were transfected with a control siRNA (Ci) or an siRNA targeting ZAPS (Zi). At 24 h posttransfection, the cells were infected with IAV. At the time points indicated, the cells were lysed and viral protein expression levels were detected by Western blotting. The ratio of the NS1 expression level in cells transfected with Zi to that in the control cells was calculated as described above. The data presented are representative of the results of three independent experiments. (Right) Western blotting confirmed that ZAPS was specifically and effectively downregulated.

