FIG 5.
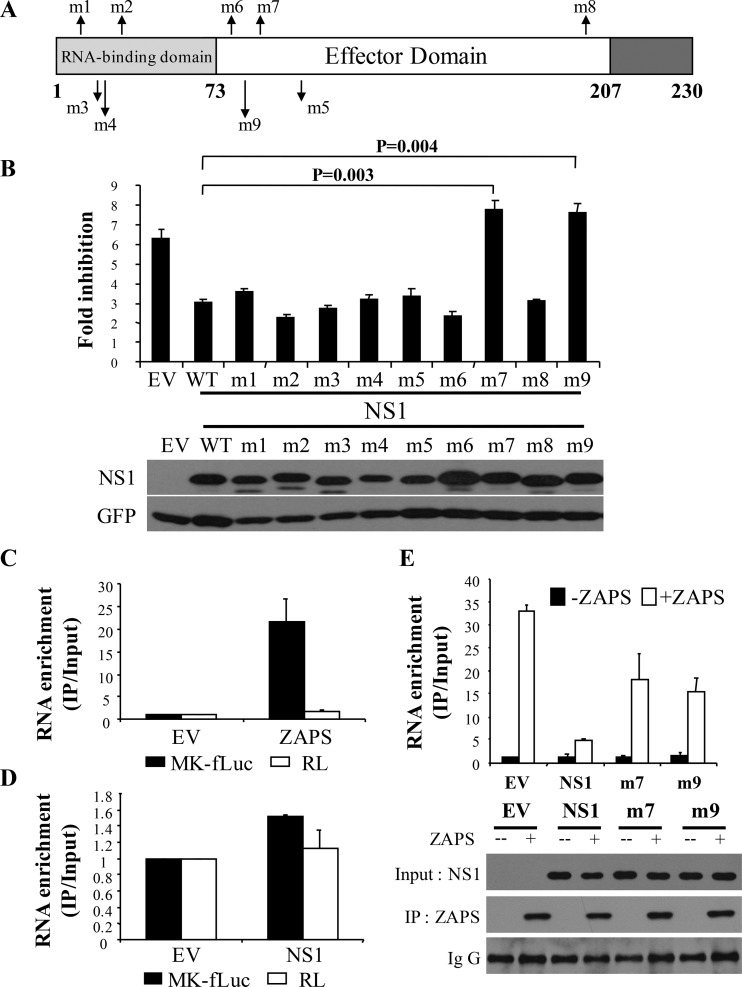
Identification of NS1 mutants that fail to antagonize ZAPS. (A) Schematic representation of NS1 mutants. (B) (Top) 293TRex-hZAPS cells were transfected with a plasmid expressing NS1 or the indicated NS1 mutants, together with the PB2-luc reporter and Renilla luciferase control reporter. At 6 h posttransfection, cells were mock treated or treated with tetracycline to induce ZAPS expression. At 48 h posttransfection, the cells were lysed and luciferase activities were measured. The fold inhibition was calculated as described in the legend to Fig. 2B. (Bottom) The expression levels of the NS1 mutants were measured by Western blotting. The data presented are means and SD of three independent experiments. (C and D) HEK293 cells were transfected with a plasmid expressing Flag-tagged NZAP or NS1, together with the ZAP-responsive reporter MK-fLuc and a control Renilla reporter (RL). At 48 h posttransfection, NZAP (C) or NS1 (D) was immunoprecipitated, and the amount of associated RNA was measured by real-time PCR. RNA enrichment was calculated as the amount of the precipitated reporter RNA divided by the amount of the RNA in the cell lysate. The relative RNA level nonspecifically associated in the lysate of empty-vector-transfected cells was set as 1. The data presented are means and SD of the results of two independent experiments. (E) (Top) HEK293 cells were transfected with a plasmid expressing NZAP and the MK-fLuc reporter, together with an empty vector or a plasmid expressing NS1 or an NS1 mutant. At 48 h posttransfection, NZAP was immunoprecipitated, and the amount of associated RNA was measured by real-time PCR. RNA enrichment was calculated as described for panels C and D. (Bottom) Western blotting confirmed that equivalent amounts of ZAPS were immunoprecipitated and that comparable levels of NS1 and the mutants were expressed.

