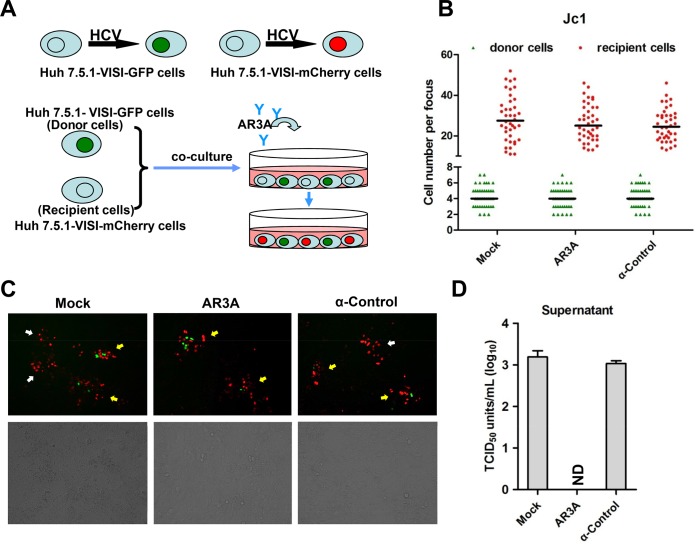
FIG 5.
Live-cell monitoring of HCV cell-to-cell transmission. (A) Schematic diagram of HCV cell-to-cell transmission system. Huh7.5.1-VISI-GFP cells electroporated with the HCV genome were used as donor cells; Huh7.5.1-VISI-mCherry cells were used as recipient cells. Donor cells were mixed at a 1:30 ratio with recipient cells. To neutralize cell-free transmission, HCV-neutralizing antibody AR3A or control antibody (HCV anti-E2 monoclonal antibody) was added to cocultures. After incubation for 96 h, images were taken under a fluorescence microscope. (B to D) Huh7.5.1-VISI-mCherry cells were cocultured with Huh7.5.1-VISI-GFP cells electroporated with Jc1 RNA in the presence of neutralizing (AR3A) or control (control) antibody or without antibody (Mock). (B) Numbers of HCV-positive donor cells (Huh7.5.1-VISI-GFP cells) or HCV-positive recipient cells (Huh7.5.1-VISI-mCherry cells) per focus after coculture for 96 h were counted. In the scatter plot, green triangles represent number of HCV-positive donor cells per focus; red dots represent number of HCV-positive recipient cells per focus; horizontal lines represent the median for 40 randomly selected foci. Statistical significance was determined by Student's t test. (C) HCV cell-to-cell transmission phenomena were observed by fluorescence microscopy after coculture for 72 h. The green fluorescence represents HCV-positive donor cells, and the red fluorescence represents HCV-positive recipient cells. The foci indicated by yellow arrows indicate virus spreading by cell-to-cell transmission with centered donor cells; the foci indicated by white arrows indicate virus spreading by cell-free transmission without donor cells. (D) Infectivity of supernatants from cocultures was determined by TCID50 titration on Huh7.5.1 cells. Means and standard deviations from three independent assays are shown (ND, not detected).

