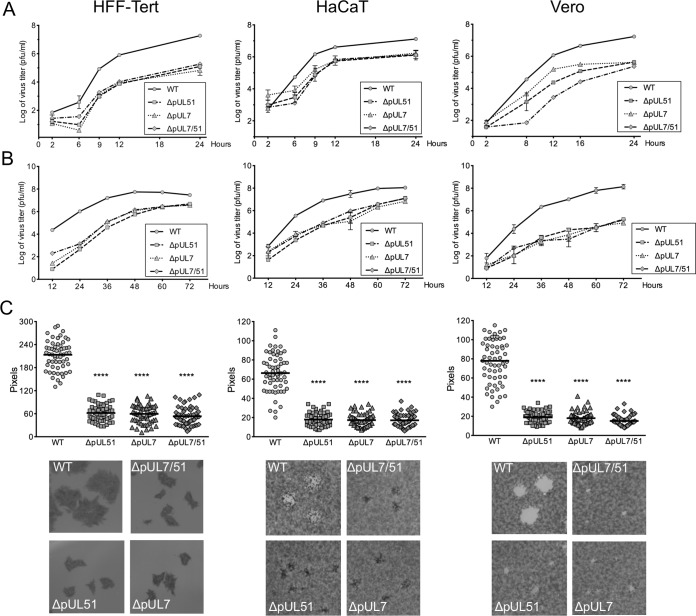
FIG 6.
Growth curves and plaque sizes of deletion viruses in HFF-Tert, HaCaT, and Vero cells. (A and B) For single-step growth curves (A) and multistep growth curves (B), cells were infected at 5 PFU/cell or 0.01 PFU/cell, respectively. Samples were harvested at the indicated times, and titers were determined by plaque assay using Vero cells. Data are presented as means of duplicates of one representative experiment ± the standard error of the mean. (C) Monolayers of cells were infected with WT or deletion viruses for 72 h. After fixing, cells were either stained with toluidine blue (HaCaT and Vero) or incubated with gD-specific antibody followed by secondary HRP antibodies (HFF-Tert). Peroxidase activity was determined with DAB peroxidase substrate. Plates were scanned, and plaque diameters were measured in Adobe Photoshop. Data show plaque sizes on 60 plaques. t test results: ****, P < 0.0001. Representative plaques are shown in the bottom panels.

