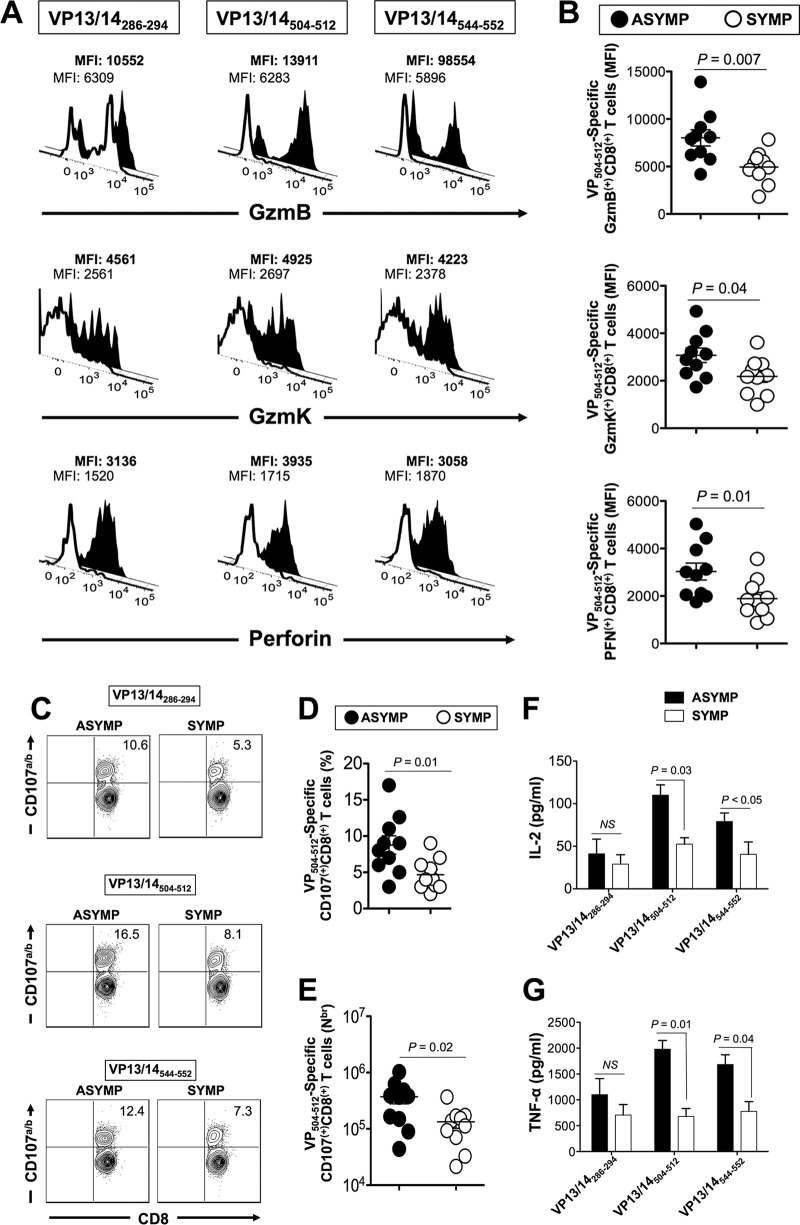
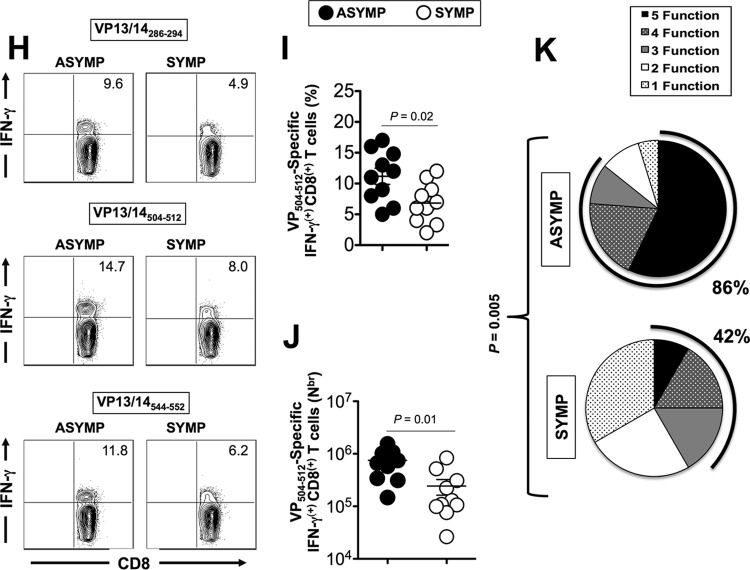
FIG 4.
Higher proportions of polyfunctional HSV-1 VP13/14 epitope-specific CD8+ T cells are detected in asymptomatic individuals. (A) Representative FACS data on the levels expression of GzmB, GzmK, and PFN on tetramer-gated CD8+ T cells specific for the VP13/14286–294, VP13/14504–512, and VP13/14544–552 epitopes, determined by FACS. Samples were acquired on a BD LSRII flow cytometer, and data analysis was performed using FlowJo software. The numbers on the top of each histogram represent MFIs, depicting the level of expression of each cytotoxic molecule. Numbers in bold represent the MFIs for ASYMP individuals, and numbers in nonbold represent the MFIs for SYMP individuals. (B) Average MFI for the levels of VP13/14504–512 epitope-specific GzmB, GzmK, and PFN expression for 10 ASYMP and 10 SYMP individuals. (C) Representative FACS data on VP13/14286–294, VP13/14504–512, and VP13/14544–552 epitope-specific CD107a/bhigh CD8+ T cells from one ASYMP individuals and one SYMP individual. (D and E) Average percentage (D) and average absolute number (Nbr) (E) of VP13/14504–512 epitope-specific CD107a/bhigh CD8+ T cells from 10 ASYMP and 10 SYMP individuals. (F and G) Average amounts of IL-2 (F) and TNF-α (G) effector cytokines produced by CD8+ T cells from ASYMP and SYMP individuals, as detected by the Luminex assay. (H) Representative FACS data for VP13/14286–294, VP13/14504–512, and VP13/14544–552 epitope-specific IFN-γhigh CD8+ T cells from one ASYMP individual and one SYMP individual. (I and J) Average percentage (I) and average absolute number (J) of VP13/14504–512 epitope-specific IFN-γhigh CD8+ T cells from 10 ASYMP and 10 SYMP individuals. (K) Pie charts representing the overall mean number of CD8+ T-cell functions detected from 10 ASYMP and 10 SYMP individuals in response to stimulation with VP13/14 peptides. The results are representative of those from 2 independent experiments. The indicated P values, calculated using an unpaired t test, show statistically significant differences between ASYMP and SYMP individuals. NS, no significant difference.


