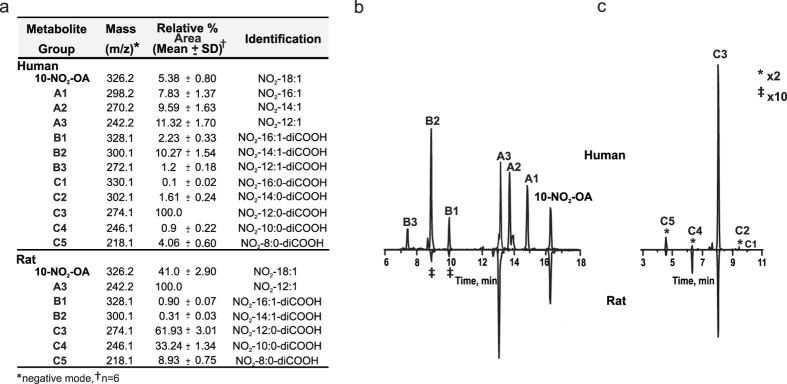
Figure 1.
(a) Relative peak areas and mass determinations for 10-NO2-OA and its metabolites in the negative ion mode 0–6 h after 10-NO2-OA dose. Comparative chromatographic profiles of: (b) 10-NO2-OA and its β-oxidation metabolites (A1 to A3) and ω-carboxylation products (B1 to B3) in human (upper panel) and rat (lower panel) urine, and (c) Saturated 10-NO2-OA ω-carboxylated derivatives in human (upper panel) and rat (lower panel) urine.

