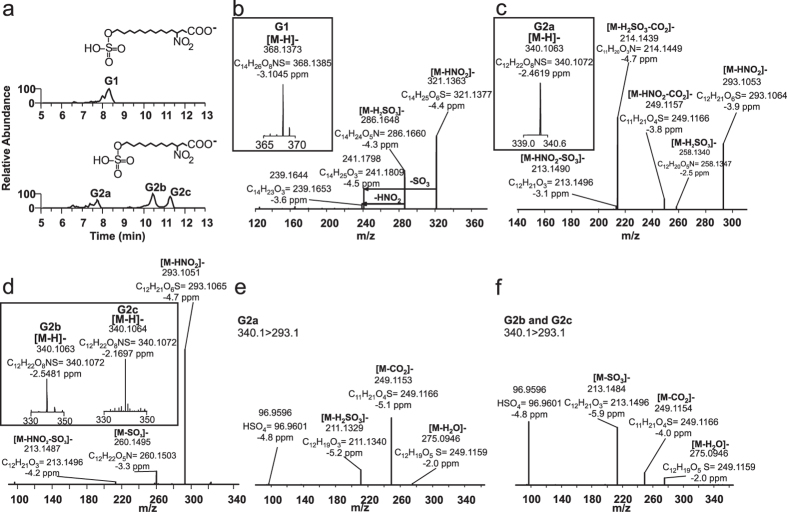
Figure 6.
(a) Chromatographic profiles of 14- (upper panel) and 12 carbon-long chain (lower panel) sulfated nitro-fatty acid metabolites from rat 0–6 h urine. (b) High resolution MS (insert) and MS/MS analysis of G1, (c) G2a and (d) G2b-c metabolites. (e) High resolution MS3 analysis of G2a and (f) G2b-c daughter ions following HNO2 neutral loss.

