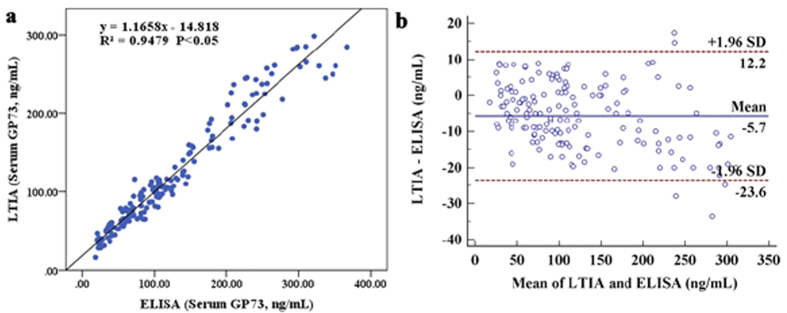
Figure 6. Correlation between LTIA and ELISA for detecting GP73.
(a) The figure shows the results from regression analysis of measured serum GP73 concentrations between LTIA (y-axis) and ELISA (x). (b) Bland–Altman plots showing the difference between the LTIA and ELISA readings at different ambient LPL levels. The x-axis shows the means of 2 readings and y-axis shows the difference between the two methods. The dashed line represents the 95% confidence limits for the differences. A regression line shown on the graph demonstrated that the mean difference between the methods was small and that there was no consistent bias preference between the methods.

