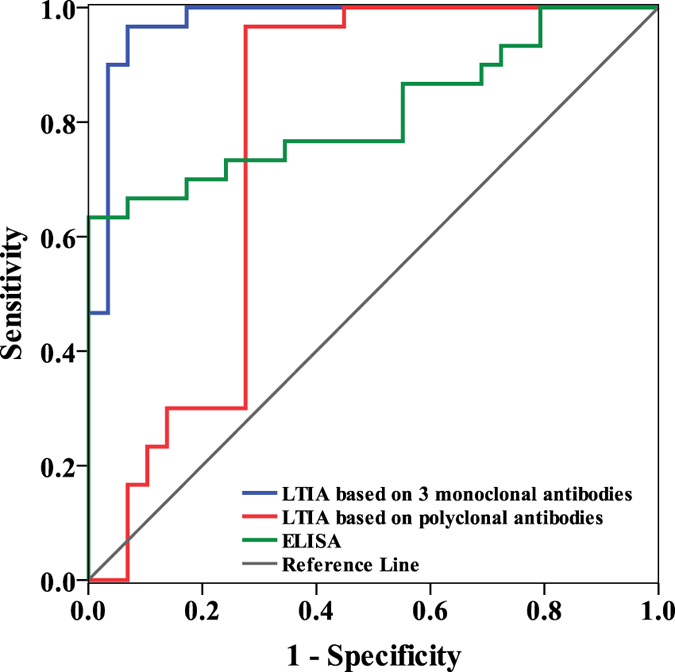
Figure 7. Receiver operating characteristic (ROC) curve analysis.

The areas under the ROC curve for LTIA based on 3 monoclonal antibodies, polyclonal antibodies and ELISA were 0.976, 0.774 and 0.820, respectively.

The areas under the ROC curve for LTIA based on 3 monoclonal antibodies, polyclonal antibodies and ELISA were 0.976, 0.774 and 0.820, respectively.