
Figure 2.
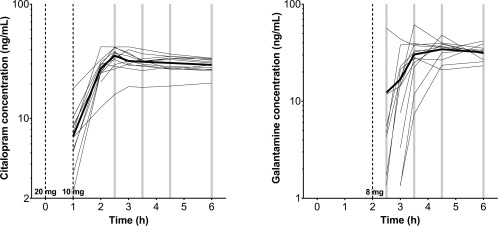
Median (bold line) and individual (thin lines) pharmacokinetic profiles for citalopram (left) and galantamine (right) concentrations in nanograms per milliliter on semi‐log scale. Gray bars illustrate moments of RS‐fMRI acquisition post drug administration. Observations below limit of quantification were dismissed.