
Figure 3.
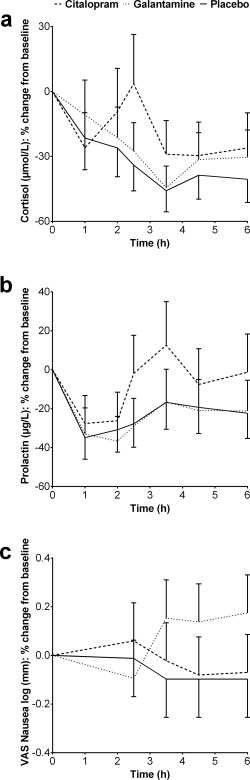
Least squares means percent change from baseline profiles of cortisol and prolactin concentrations and nausea as measured with the Visual Analogue Scales (with standard errors of the mean as error bars).
Official websites use .gov
A
.gov website belongs to an official
government organization in the United States.
Secure .gov websites use HTTPS
A lock (
) or https:// means you've safely
connected to the .gov website. Share sensitive
information only on official, secure websites.
Least squares means percent change from baseline profiles of cortisol and prolactin concentrations and nausea as measured with the Visual Analogue Scales (with standard errors of the mean as error bars).