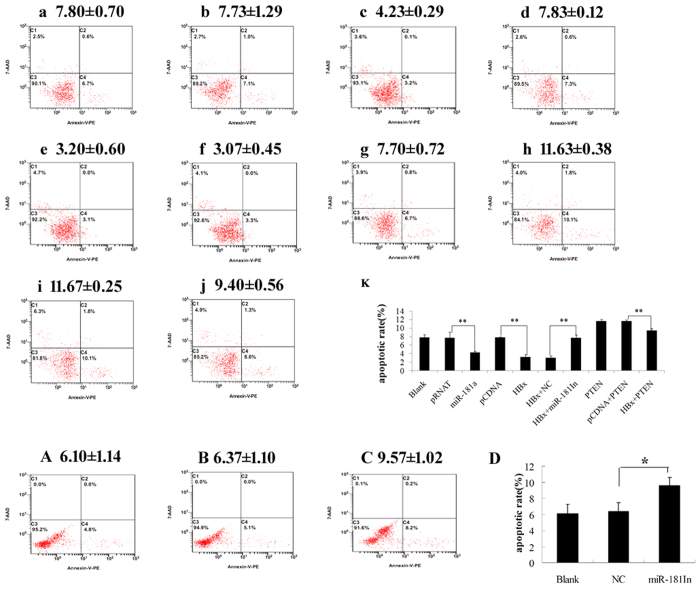
Figure 5. HBx inhibits cell apoptosis through up-regulates miR-181a and in turn down-regulates PTEN.
Cell apoptosis was analyzed by using the Annexin V-PE apoptosis detection kit. Apoptosis rate of HepG2 cells transfected with miR-181a and the corresponding controls, versus the blank group (a Blank, b pRNAT, c miR-181a). Apoptosis rate of HepG2 cells transfected with pHBx and the corresponding control (d pcDNA3.0, e HBx), cotransfected with pHBx and miR-181a inhibitor and the corresponding control (f HBx + NC, g HBx + miR-181In). Apoptosis rate of HepG2 cells transfected with PTEN, pHBx cotransfected with PTEN, pcDNA3.0 cotransfected with PTEN (h PTEN, i pcDNA + PTEN, j. HBx + PTEN). k Histogram of the apoptosis rate from group a to j. Apoptosis rate of HepG2.2.15 cells transfected with miR-181a inhibitor (miR-181In) and the corresponding controls (NC), versus the blank group (A Blank, B NC, C miR-181In). (D) Histogram of the apoptosis rate from group A to C. (n = 3, * p < 0.05, **p < 0.01).

