
Figure 7. Cell viability assay (MTT assay) reveals the effect of HBx and miR-181a on cell proliferation.
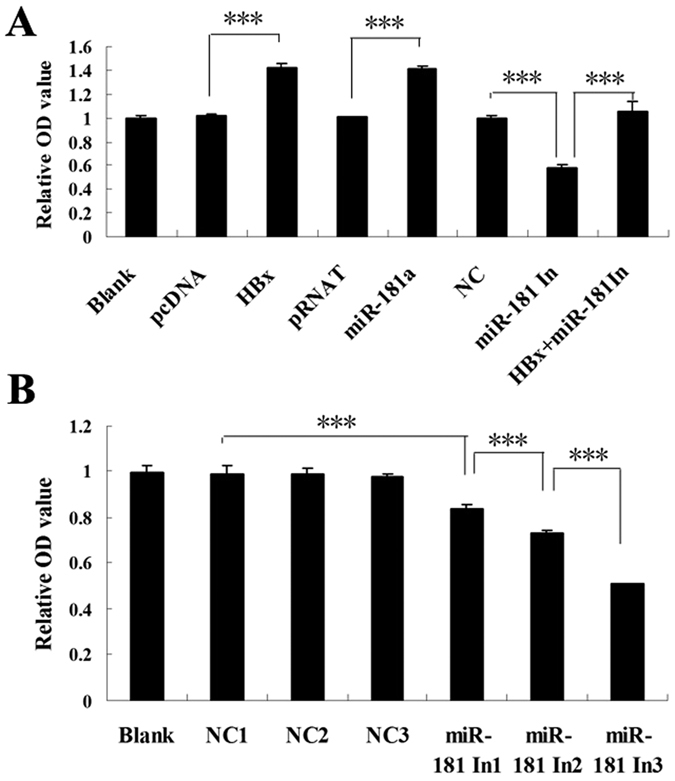
(A) MTT assay for HepG2 cells transfected by pHBx, miR-181a, miR-181a inhibitor (miR-181In) and corresponding controls, and cells cotransfected with pHBx and miR-181a inhibitor (miR-181In), versus the blank group. (B) MTT assay for HepG2.2.15 cells transfected with miR-181a inhibitor (miR-181a In1, miR-181a In2, miR-181a In3) and the corresponding controls (NC1, NC2, NC3) at different doses (0.125 pM, 0.25 pM, 0.5 pM, respectively), versus the blank group (n = 3, ***p < 0.001).