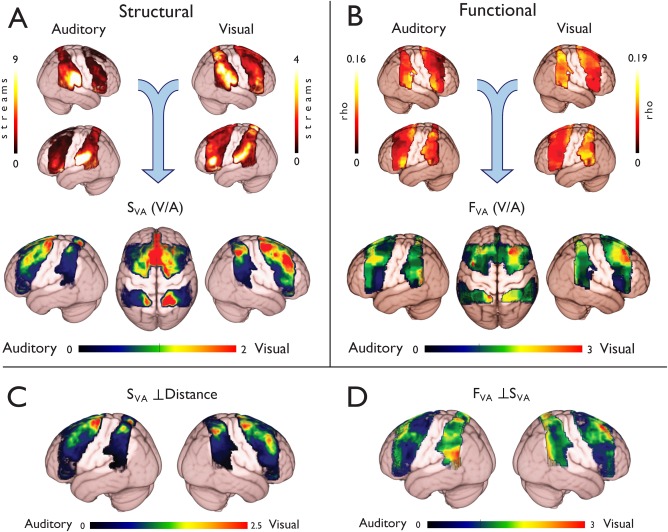
Figure 2.

Visual–auditory connectivity differences in frontoparietal cortex. (A) Structural connectivity was assessed by counting the number of probabilistic tractography streamlines (“streams”) that reached the auditory and visual targets cortices. Relative structural connectivity was assessed by comparing the visual and auditory maps (V/A; SVA). This analysis revealed marked connectivity differences, where dorsal regions were biased toward visual connections, while ventral regions showed an auditory bias. (B) Functional connectivity was assessed using multivariate methods (see Fig. 1). A similar dorsal to ventral gradient was observed in the ratio image (FVA), with dorsal regions favoring visual, and ventral regions favoring auditory targets. (C) The relative Euclidian (straight line) distance to the targets was regressed out of the structural data to test for a potential confound. This analysis still revealed distinct foci of visual and auditory bias in dorsal and ventral regions respectively. (D) The structural results were regressed out of the functional results to test whether the structural pattern could explain the observed functional biases. Residual functional connectivity differences were observed in both prefrontal and parietal cortices.
