
Figure 4.
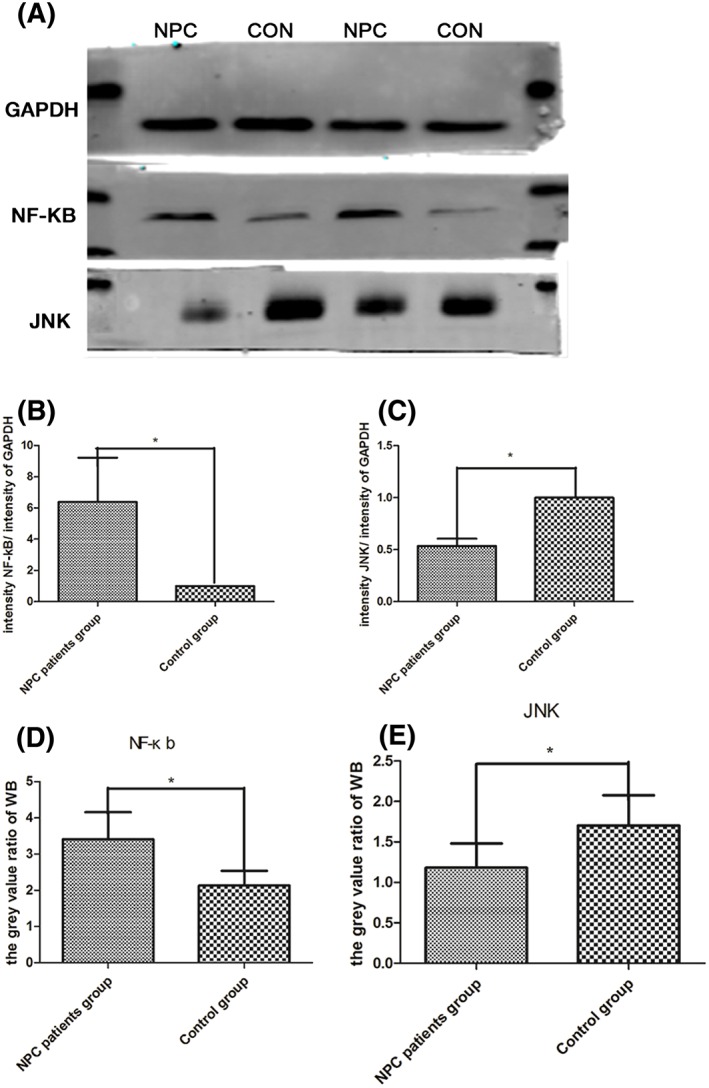
A, Western blot was performed with antibodies against GAPDH, NF‐κb, and JNK. B and C, On the basis of the RQ values from the NPC patient and the control group, NF‐κb levels increased to 6.38:1 (P < .05), and JNK mRNA expression decreased to 0.53:1 (P < .05). B and D, NF‐κb gene and protein expression levels were upregulated in the NPC patient group. The RQ relative value was 6.38, and the gray value ratio was 5.74, whereas the RQ relative value and the gray value ratio for the control group were 1 and 3.47, respectively.4 JNK expression was downregulated. C and E, The RQ expression value was 0.53:1 (P = .00), and the gray value ratio for the NPC patient group was 1.53, whereas the RQ relative value and the gray value ratio for the control group were 1 and 2.25, respectively. *P < .05