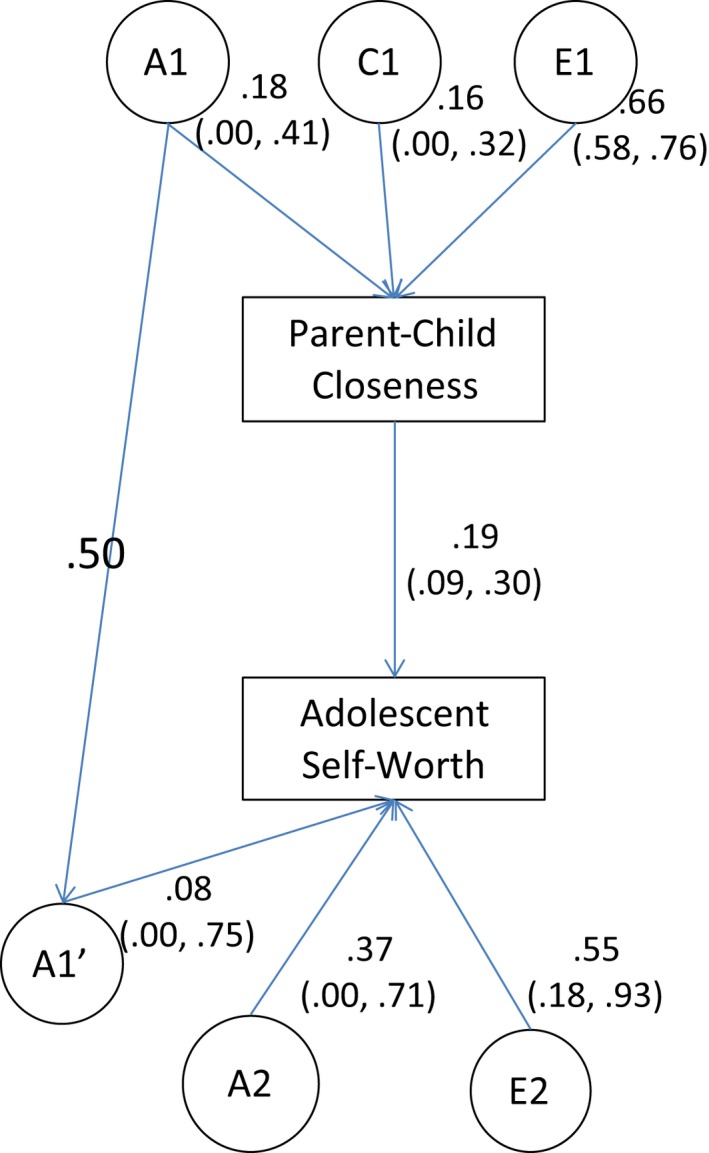
Figure 2.

Structural equation models showing the association between parent‐reported parent–child closeness and adolescent self‐worth. Path estimates are from the full (unconstrained) model in which all parameters are freely estimated. A1, Additive genetic effects on closeness; C1, shared environmental effects on closeness; E1, nonshared environmental effects on closeness; A1′, genetic effects common to parent–child closeness and adolescent self‐worth; A2, genetic effects specific to adolescent self‐worth; E2, nonshared environmental effects on adolescent self‐worth. The path between Parent–Child Closeness and Adolescent Self‐Worth is the phenotypic transmission pathway. NB, the pathway between A1 and A1′ is fixed to .50 because parents and children share 50% of their genome
