
Figure 1.
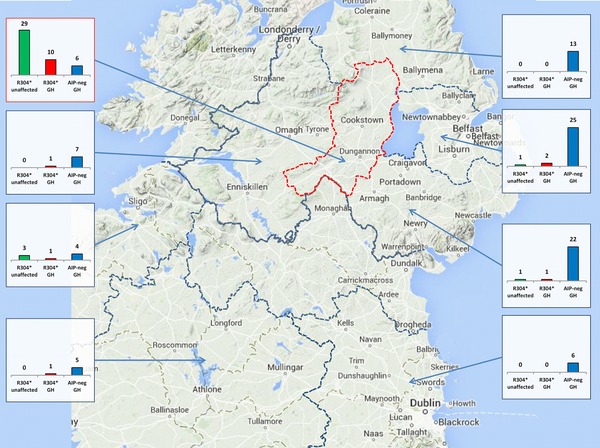
Geographical distribution of R304* allele carriers in Ireland, compared to AIPmut–negative patients with somatotrophinomas. R304* carriers, unaffected (R304* unaffected, green columns) and patients with somatotrophinomas (R304* GH, red columns) were compared to AIPmut–negative patients with somatotrophinomas (AIP–neg GH, blue columns). Only subjects currently residing in Ireland were included; R304*–positive patients with other PA types (n = 5) are not shown. The map was arbitrarily divided into regions separated by dotted borders, red for Mid Ulster. Ninety percent of the Mid Ulster screening subjects resided here, including all six R304* carriers. Each small graph summarizes data from the region indicated by the corresponding arrow; the y–axis scale is identical for all graphs.