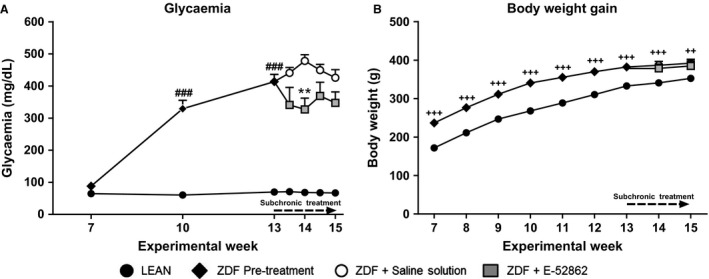
Figure 1.

Evolution of the glycaemia and body weight gain in Zucker diabetic fatty (ZDF) treated with saline or E‐52862 and LEAN rats. (A) Lines represent the mean ± SEM of the glucose levels on weeks 7, 10, 13, 14 and 15. (B) Weekly increase in body weight. A one‐way ANOVA followed by Bonferroni post hoc test was used for statistical analysis of glycaemia differences between week 7 values (###p < 0.001) and between saline‐ and E‐52862‐treated ZDF‐rats (**p < 0.01). A two‐way ANOVA followed by Bonferroni post‐hoc test was used when comparing body weight among the three groups (++p < 0.01; +++p < 0.001 vs. LEAN) (n = 7–8).
