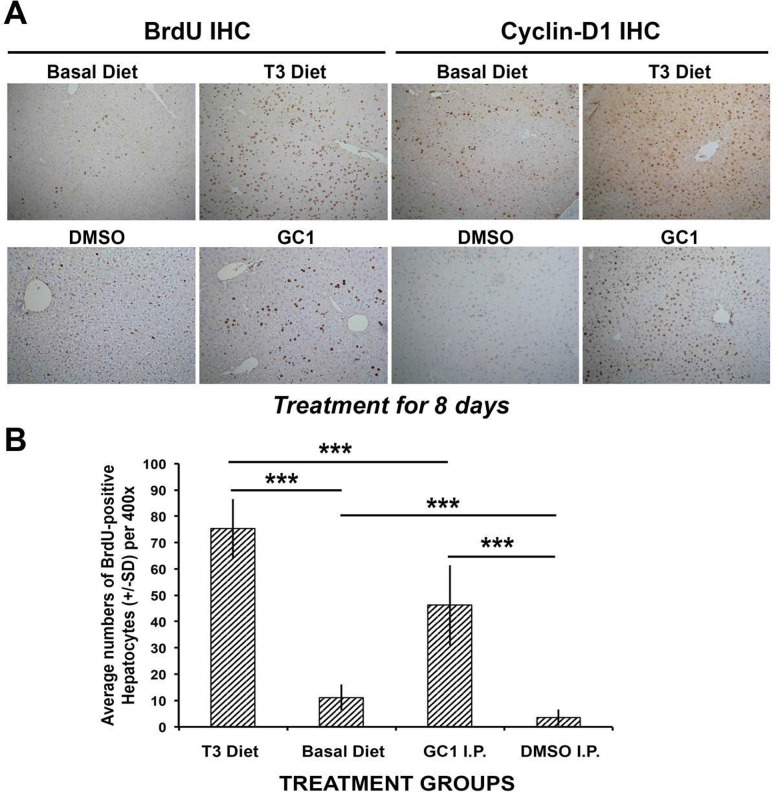
Figure 2.
Comparison of T3 diet-supplemented versus GC-1-injected mice. (A) Immunohistochemistry for BrdU and cyclin D1 shows increased staining in the T3 and GC-1 treatment groups when compared with respective controls (100×). (B) Bar graphs showing average number of BrdU-positive hepatocyte nuclei per high-power field (HPF) (400×) in different conditions. Ten HPFs were counted for each group. T3 diet showed the highest proliferation when compared with basal diet and with GC-1 injections (***p < 0.001). GC-1 showed increased proliferation when compared to DMSO-injected controls (***p < 0.001). DMSO-injected controls had less baseline proliferation than basal diet-fed animals with no other intervention (***p < 0.001).

