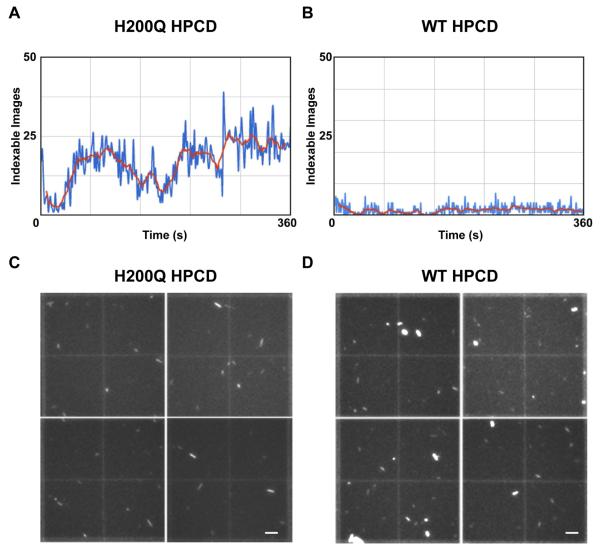
Figure 1. Representative observed indexing rates and crystal density quantification for both H200Q and WT HPCD slurries.
A plot of the number of indexable patterns observed during a representative 6 minutes of data collection using the GDVN injector with the H200Q HPCD microcrystal sample (A) and with the WT HPCD microcrystal sample (B) illustrates the reduced hit rate observed for the WT sample. The number of indexable hits/second from cctbx.xfel processing are plotted, where the blue trace indicates total number of indexable images per second and the red trace is the averaged indexing rate every 11 sec. Representative hemocytometer quadrants, reconstructed from 4 separate images using a 15x objective on a JanScientific Jansi UVEX microscope, illustrate fairly similar crystal densities for H200Q (C) and WT (D) slurries. Crystal quantification was achieved for both slurries using manual counting with ImageJ software (see experimental section, scale bars – C,D: 50 μm) (n=12)

