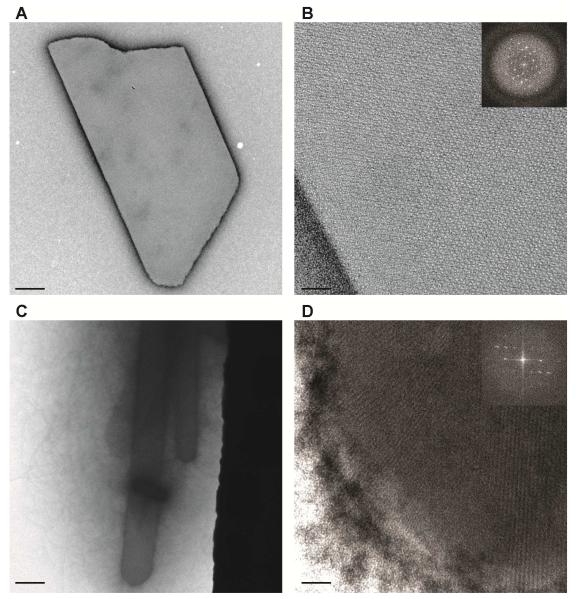
Figure 2. Negative-stain TEM images of HPCD microcrystals.
A,B. Representative TEM sampling of H200Q crystals, illustrates sample monodispersity (A), with high quality crystal lattices (B) as determined from its FFT profile (inset). On average, 4th order Bragg spots were recorded for H200Q crystals.
C,D. Representative TEM sampling of WT crystals, illustrates sample aggregation or crystal conglomerates (C), typically not seen with brightfield or UV microscopy. Lattice quality was of high quality (D), with an average of 3rd order Bragg spots observed for WT samples. (Scale bars – A,C: 0.5 μm; B,D: 50 nm)

