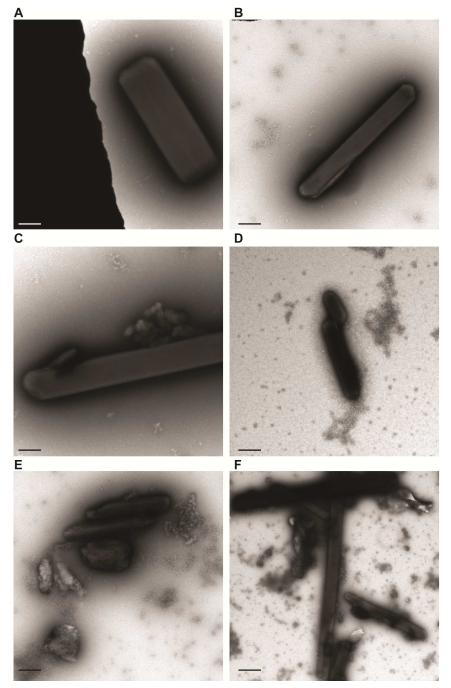
Figure 4. Negative-stain TEM analysis of bulk fragmentation methods for needle-like 2,3 – HPCD microcrystals.
A,B. TEM images of H200Q (A) or WT (B) crystals after fractionation with centrifugation.
C,D. TEM images of H200Q (C) or WT (D) crystals after fractionation with vortexing.
E,F. TEM images of H200Q (E) or WT (F) crystals after fractionation with sonication.
Lattice quality was evaluated when single crystals were observed and median values of 3rd order Bragg spots (not shown) for all samples across the varying fragmentation protocols. (Scale bars – A-F: 1 μm)

