
Figure 1.
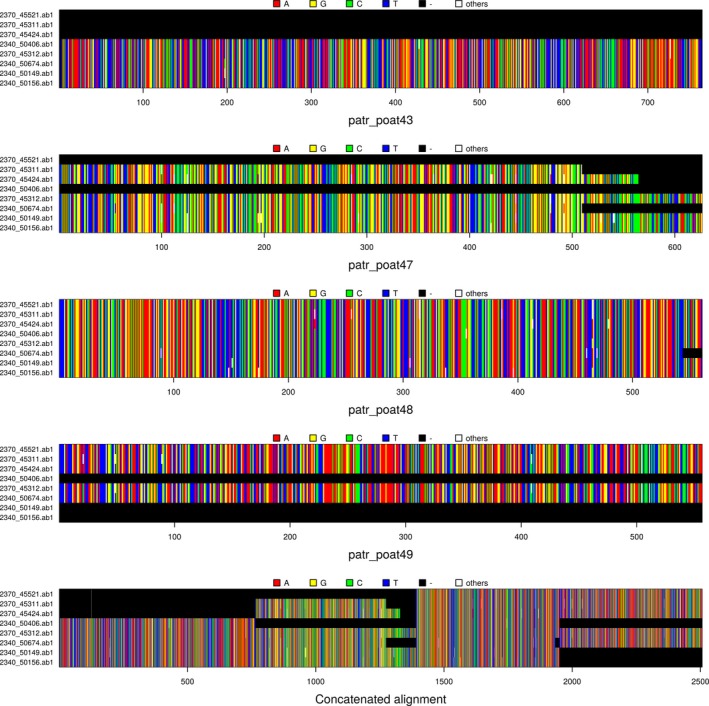
Individual and concatenated sequence alignments of chickadees data. The first four graphs are a plot of a multidna object containing DNA alignments for four different loci (patr_poat 43, 47, 48 and 49). The fifth graph displays the concatenated alignment.