
Figure 6.
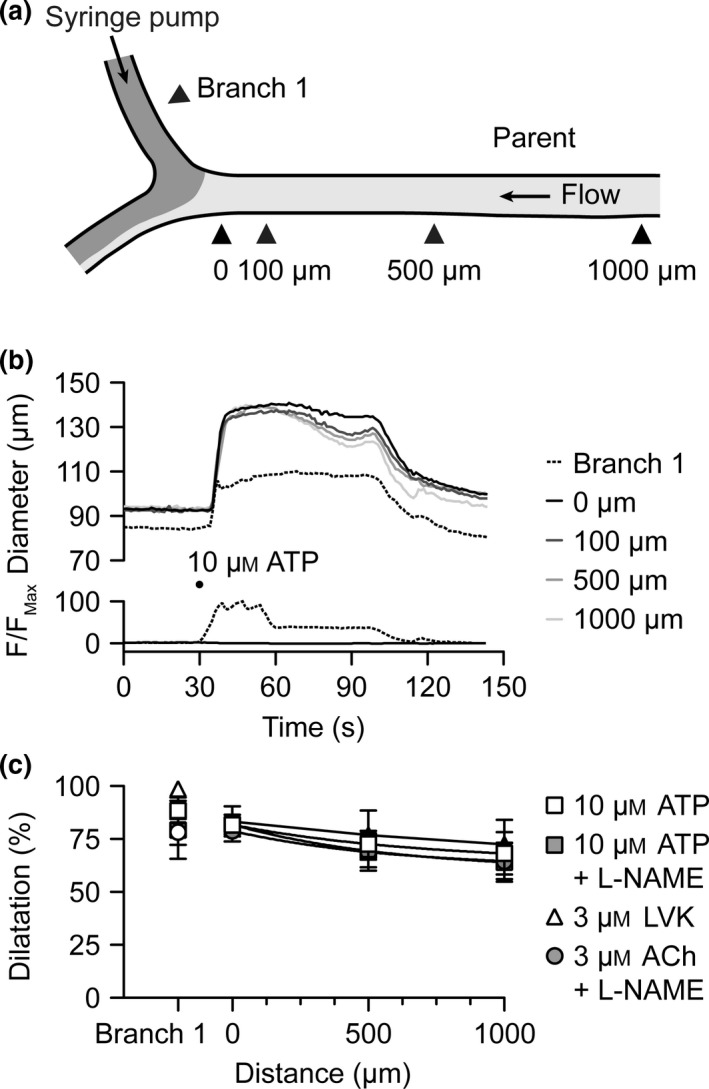
Conducted dilatation to luminal ATP. (a) Schematic of triple‐cannulated arteriole set up with a syringe pump attached to the branch 1 cannulating pipette, and flow into the parent arteriole generated by a pressure gradient (see Materials and methods). (b) Representative time course of changes in diameter and fluorescence intensity in response to luminally pumped solution containing ATP (10 μ m) and carboxyfluorescein. Measurements were taken in branch 1 and at sites 0–1000 μm upstream [indicated by arrowheads in (a)]. (c) Summary data showing local and conducted dilatation responses to ATP and LVK under control conditions (white squares, n = 5; and white triangles, n = 3); and responses to ATP and ACh in the presence of the nitric oxide synthase inhibitor L‐NAME (100 μ m, each n = 5).