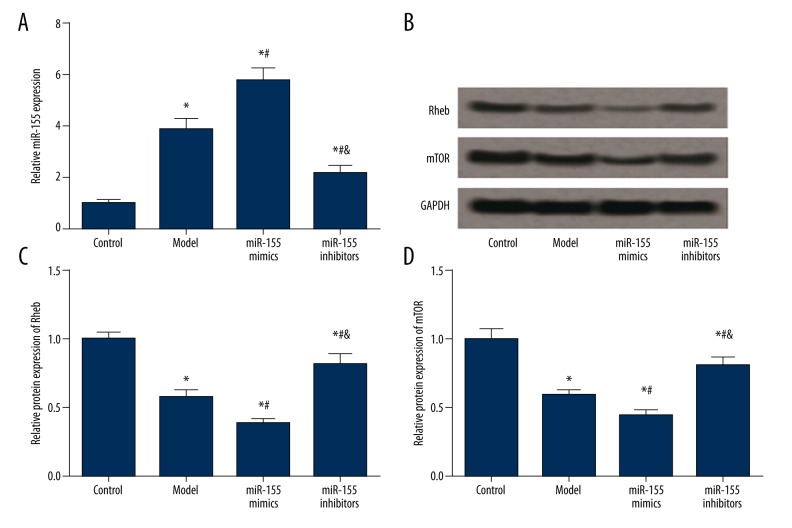
Figure 4.
Expression of miR-155, Rheb and mTOR in brain tissues of model rats. (A) Quantified mRNA level of miR-155 in tissues for different groups (i.e. control, model, miR-155 mimics and miR-155 inhibitors). (B) Western blot analysis of Rheb and mTOR in tissues with GAPDH as the reference. (C, D) Quantified protein level of Rheb (C) and mTOR (D) in tissues. Data were displayed as mean ±SD. * P<0.05 vs. the control group; # P<0.05 vs. the model group; & P<0.05 vs. the miR-155 mimics group.

