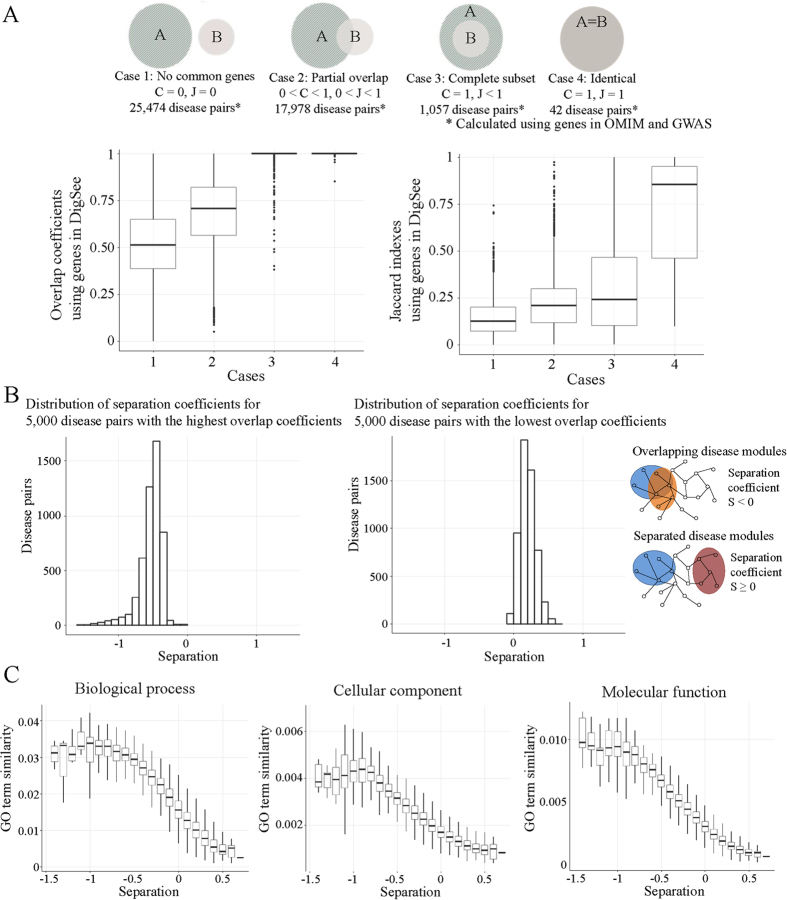
Figure 6. Relationships between diseases.
(A) Disease pairs were classified into four groups using genes in OMIM and GWAS. For these disease pairs, the overlap coefficients and Jaccard indices were calculated using genes in DigSee. (B) Distributions of separation coefficients of disease pairs in the protein interaction network are different for two groups of disease pairs: 5000 disease pairs having the highest overlap coefficients, and 5000 disease pairs having the lowest overlap coefficients. Negative values of separation coefficients S indicate that genes are close in the protein interaction network, whereas positive values indicate that genes are separate in the network. (C) Disease pairs that are closer in the protein interaction network (with smaller separation coefficients) are more likely to have high gene ontology (GO) term similarities for biological process, cellular component, and molecular function.

