Figure 1.

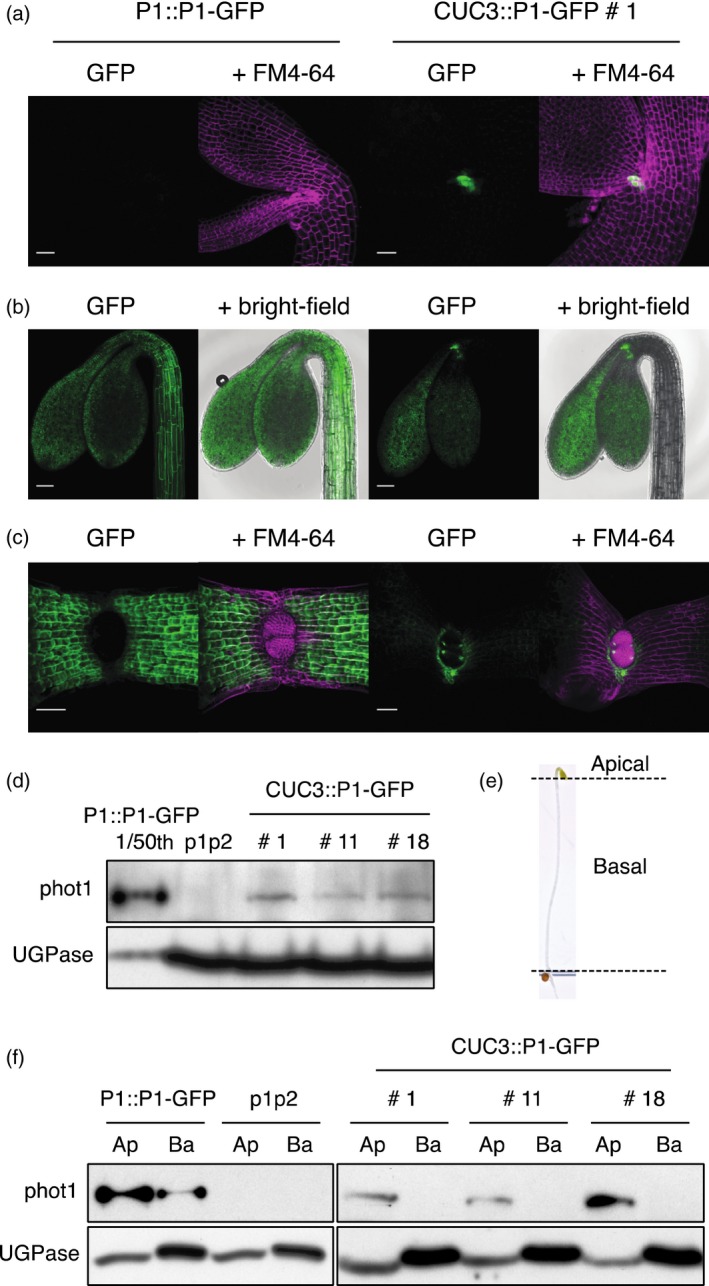
Expression and localization of PHOT1::PHOT1‐ GFP (P1::P1–GFP) and CUC3::PHOT1–GFP (CUC3::P1–GFP) in transgenic lines.
(a) Localization in embryos. SUM projection images of embryos expressing P1::P1–GFP or CUC3::P1–GFP. GFP is shown in green and FM4‐64 in magenta. Bar, 25 μm.
(b) Localization in etiolated seedlings. SUM projection images of 3‐day‐old etiolated seedlings expressing P1::P1–GFP or CUC3::P1–GFP. GFP is shown in green and the bright‐field image in grey. Bar, 100 μm.
(c) Localization in de‐etiolated seedlings. SUM projection images of 4‐day‐old de‐etiolated seedlings expressing P1::P1–GFP or CUC3::P1–GFP. GFP is shown in green and FM4‐64 in magenta. Bar, 50 μm.
(d) Immunoblot analysis of total protein extracts from whole 3‐day‐old seedlings expressing P1::P1–GFP, three independent lines expressing CUC3::P1–GFP (lines 1, 11 and 18) and the phot1 phot2 double mutant (p1p2). For P1::P1–GFP a 1 in 50 dilution of the total protein extract was loaded. Protein extracts were probed with anti‐phot1 antibody (phot1) and antibody raised against UDP‐glucose pyrophosphorylase (UGPase) as a loading control.
(e) Picture of a 3‐day‐old etiolated seedling showing positioning of dissections of apical and basal segments.
(f) Immunoblot analysis of total protein extracts from 3‐day‐old etiolated seedlings dissected into apical (Ap) and basal (Ba) segments. Protein extracts were probed with anti‐phot1 antibody (phot1) and antibody raised against UDP‐glucose pyrophosphorylase (UGPase) as a loading control.
