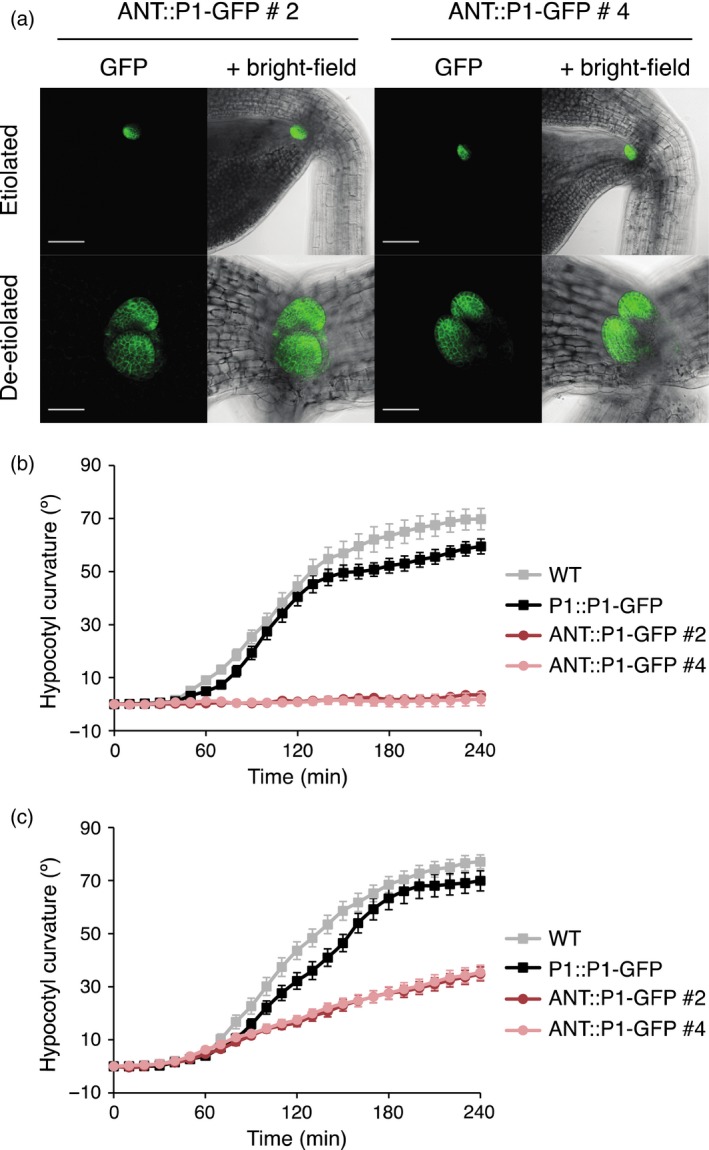
Figure 6.

Localization and functionality of ANT::PHOT1–GFP (ANT::P1–GFP, lines 2 and 4) in transgenic lines.
(a) Localization in etiolated and de‐etiolated seedlings. SUM projection images of 3‐day‐old etiolated seedlings (upper panels) and 4‐day‐old de‐etiolated seedlings (lower panels). GFP is shown in green and the bright‐field image in grey. Upper panels, bar 100 μm; lower panels, bar 50 μm.
(b) Phototropism of 3‐day‐old etiolated wild‐type (WT) seedlings, seedlings expressing PHOT1::PHOT1–GFP (P1::P1–GFP) or two independent lines expressing ANT::PHOT1–GFP (ANT::P1–GFP lines 2 and 4). Seedlings irradiated with 0.005 μmol m−2 sec−1 of unilateral blue light for 4 h. Hypocotyl curvatures were measured every 10 min and each value is the mean ± standard error (SE) of 19–20 seedlings.
(c) Phototropism of 3‐day‐old etiolated seedlings performed as in (b), except seedlings were irradiated with 0.5 μmol m−2 sec−1 of unilateral blue light.
