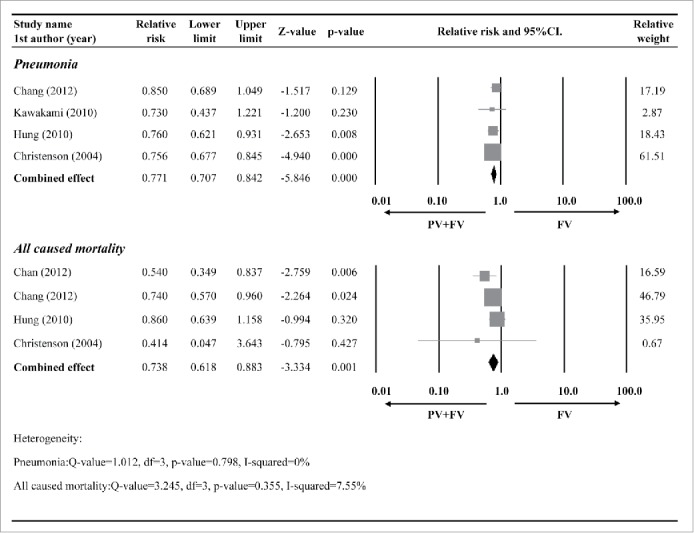
Figure 2.

Forest plots comparing the pneumonia and all-cause mortality rates between patients that that received the influenza vaccination (FV) alone and those that received an influenza plus pneumococcal vaccination (PV). Abbreviations: RR, relative risk; CI, confidence interval; Lower limit, lower boundary of the 95% CI; Upper limit, upper boundary of the 95% CI.
