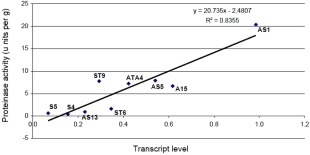
Figure 4.

Linear regression analysis of the square root of the averages SPR1 transcript levels and proteinase activities for transformants S4, S5, AS1, AS5, AS13, ST6 and ST9 and controls (A15 and ATA4). The equation of the fitted line is: Serine proteinase activity = 20.7 x SPR1 transcript level–2.48.
