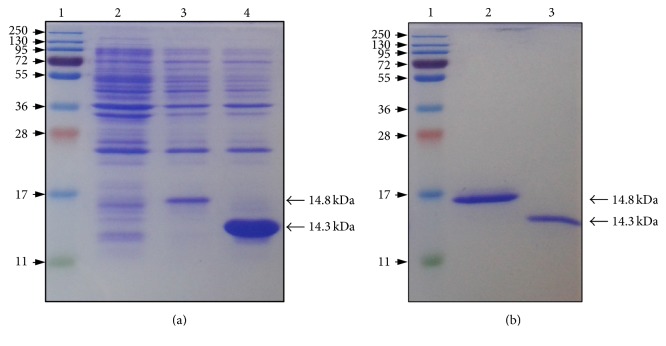
Figure 3.
(a) SDS-PAGE analysis of crude protein extracts from E. coli cells expressing either the C2α domain or the C2β domain, in comparison to the empty vector as expression control. Lane 1: molecular mass marker, lane 2: empty vector, lane 3: C2α domain, and lane 4: C2β domain. (b) SDS-PAGE analysis of affinity purified C2α domain and C2β domain. Lane 1: molecular mass marker, lane 2: C2α domain, and lane 3: C2β domain. Protein migrations were performed using 15% SDS-PAGE and stained with Coomassie Brilliant Blue R-250.

