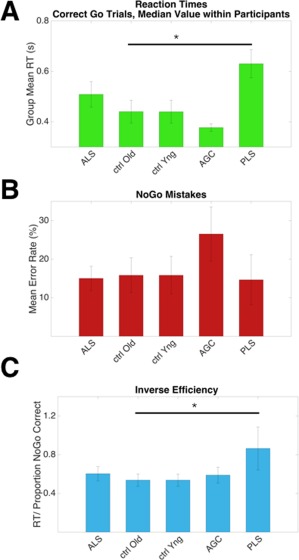
Figure 2.

Behavioral data detailing task performance across groups. A: PLS patients responded slower than older controls, P = 0.016. B: A trend towards more NoGo errors was made by pre symptomatic carriers. C: Inverse efficiency, a global measure of task performance (RT/NoGo proportion correct) was impaired in the PLS group (P = 0.022). Median values within participants, mean values within group, error bars = SEM. Uncorrected for multiple comparisons. [Color figure can be viewed at http://wileyonlinelibrary.com.]
