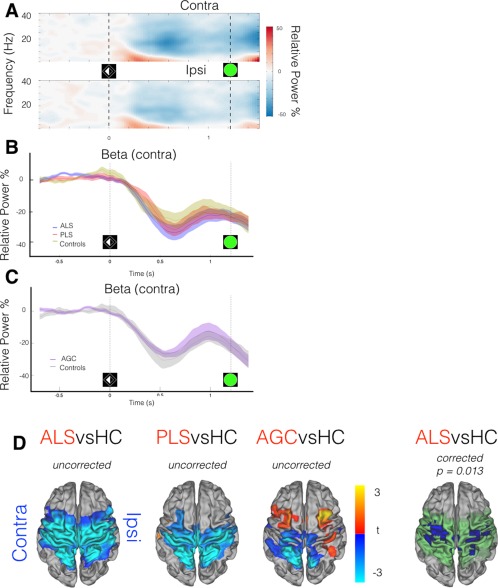
Figure 3.

MEG data epoched around cue (t 0 = laterality cue appearance). A: Neural correlate of task performance across frequency range demonstrated in TFR (averaged across healthy controls only) from motor cortex ROIs, contra/ipsilateral relative to effector limb. Beta‐band (15:30 Hz) power decrease (desynchronization) from baseline (more intense desynchronization = deeper blue) occurs during motor preparation, particularly in the contralateral hemisphere, maximally 600 ms post‐cue. B,C: Beta‐band power (relative to baseline) within contralateral motor cortex ROI, group comparisons. D: ALS patients show deeper beta desynchronization. t 0 + 500 ms: t 0 + 700 ms. t stats in red/blue, motor cortex mask used for statistics in green. Cluster correction within motor cortex mask, not across groups. Vertical lines denote appearance of visual laterality cue and go/Nogo target. [Color figure can be viewed at http://wileyonlinelibrary.com.]
