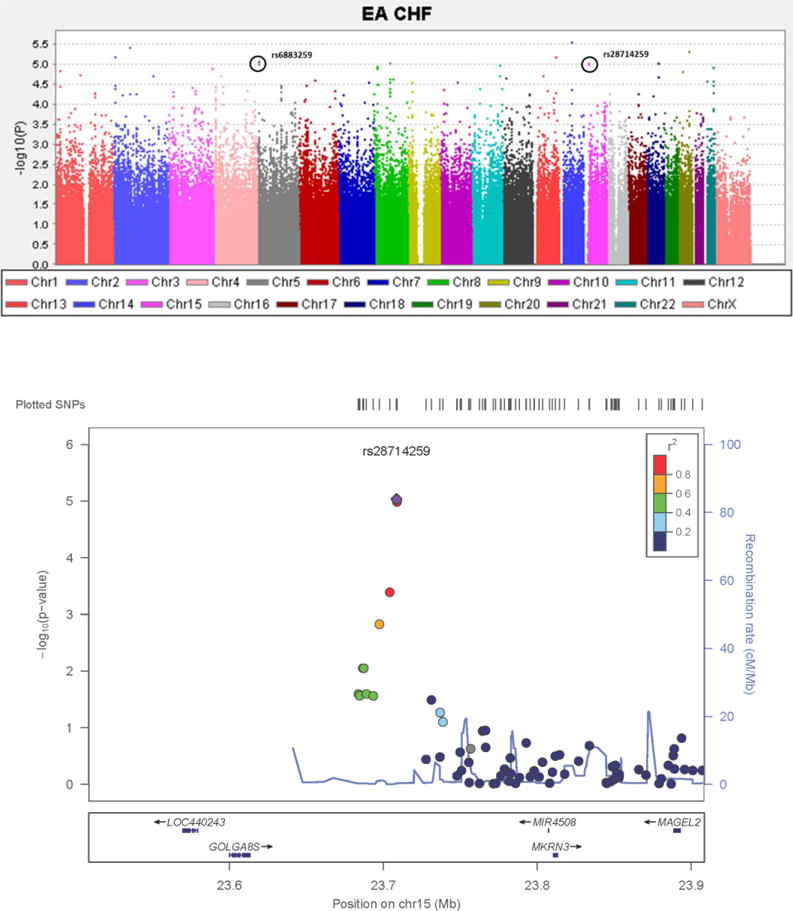
FIGURE 3.

CHF GWAS in EA cohort in E5103. A) Manhattan plot for centrally reviewed, cardiologist-adjudicated congestive heart failure from EA. X-axis indicates the chromosomal position of each SNP analyzed; Y-axis denotes magnitude of the evidence for association, shown as –log10(p-value). SNPs genotyped in the two independent samples are circled; B) p-values (−log10) of SNPs near rs28714259 from SNP association analysis with CHF. SNPs are colored to reflect their LD with rs28714259.
