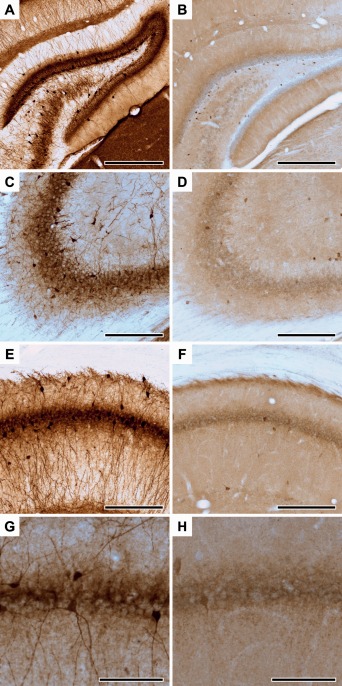
Figure 2.

Representative photomicrographs of parvalbumin‐ and cholecystokinin‐immunoreactive neurons in the dorsal hippocampus. PV+ neurons in the dentate gyrus (A), CA3 (C) and CA1 areas (E, G). CCK+ neurons in the dentate gyrus (B), CA3 (D) and CA1 areas (F, H). Panels G and H show high magnification images of PV+ (G) and CCK+ (H) interneurons projecting to the CA1 pyramidal cell layer. Scale bars: 250 µm for A‐F and 100 µm for G‐H. [Color figure can be viewed at wileyonlinelibrary.com]
